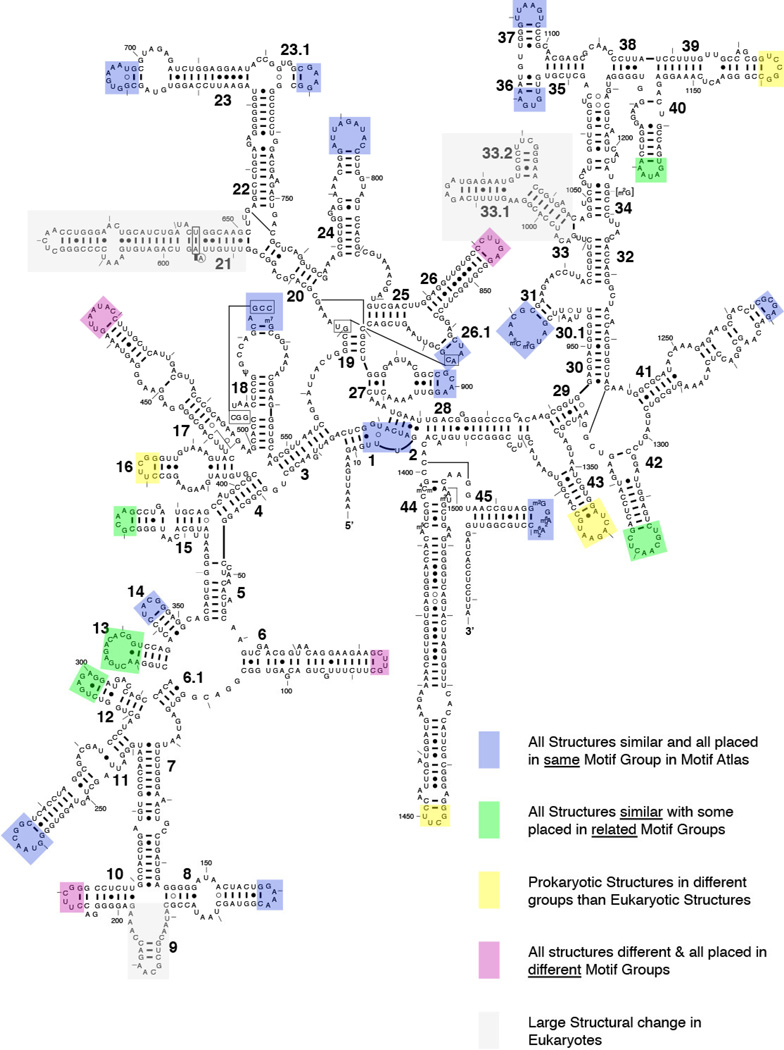
Figure 7.
Bacterial 16S rRNA secondary structure (E. coli sequence). Each hairpin loop in a conserved region is assessed based upon the conservation across E. coli (2AW7), T. thermophilus (1FJG), S. cerevisiae (3U5F), and T. thermophila (4BPP). The coloring of each box on the hairpins indicates the results of clustering in motif atlas version 1.18. Loops which form similar structures and are placed in the same group are placed in blue boxes. Loops which are similar in structure across all loops and are placed in related groups are in green. Loops which form different structures between Prokaryotes and Eukaryotes are in pink. Finally, the regions which some large differences between Prokaryotes and Eukaryotes are shown with grey boxes. The data is in Supplemental Data 1.

