
Figure 4.
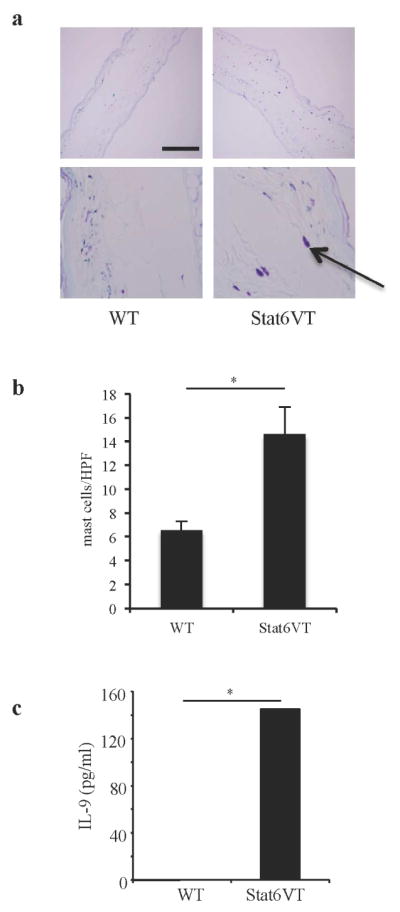
Increased mast cell numbers in skin from Stat6VT mice. A, Mast cell numbers were evaluated in skin tissue sections stained with toluidine blue. Scale bar indicates 0.4 mm for the top panels and 0.07 mm for the bottom panels. An arrow pointing towards a mast cell is shown. B, Graph represents the mean ± SEM of 5–7 mice per group. C, CD4+ T cells from WT and Stat6VT transgenic mice were stimulated with anti-CD3 and supernatants were tested for IL-9 concentration using ELISA. *p < 0.05.