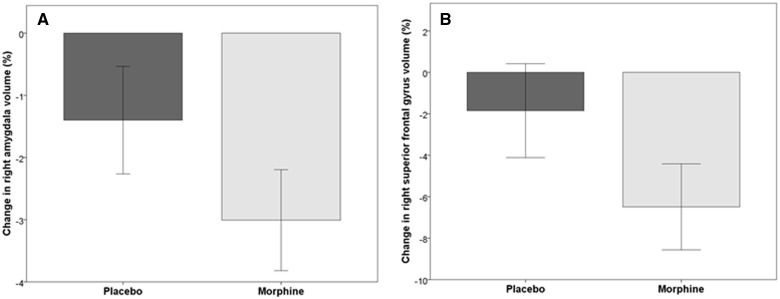
Figure 3.
Bar graphs showing percent volumetric change from baseline in the (A) right amygdala and (B) right superior frontal gyrus for the placebo group (left bar) and morphine group (right bar). Error bars represent 95% confidence intervals. At a voxel-level false discovery rate of P < 0.05, gray matter volume is significantly decreased in the right amygdala and right superior frontal gyrus after morphine exposure and the placebo group shows no significant change.

