
Fig. 6.
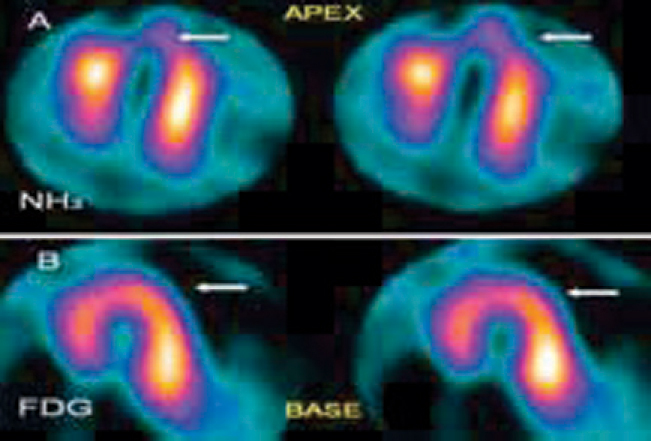
(A and B): Cardiac PET/CT Scan, horizontal long axis sections of the left ventricle: NH3 rest perfusion images (A, Top Row) show a perfusion defect (arrow) in the apex of left ventricle. FDG metabolism images (B, Bottom Row) reveal normal FDG uptake in the apex. Inference: hypo-perfused but viable (hibernating) myocardium in the apex.