FIGURE 1.

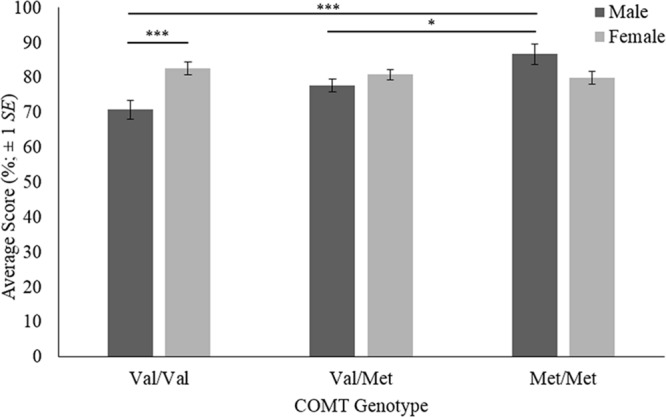
Face recognition scores for COMT genotypes by sex. The error bars are based on ±1 standard error. ∗p < 0.05, ∗∗∗p < 0.001.

Face recognition scores for COMT genotypes by sex. The error bars are based on ±1 standard error. ∗p < 0.05, ∗∗∗p < 0.001.