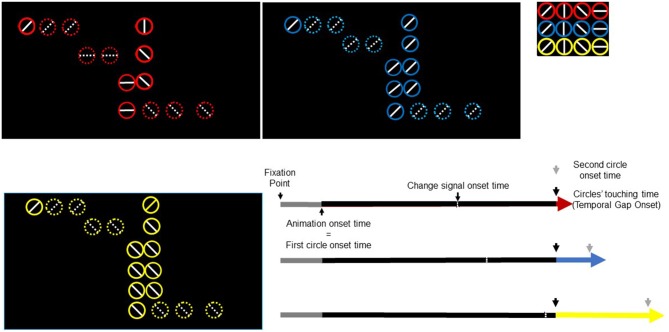
Figure 1.
Trial timeline for three task conditions and three temporal gaps. Black rectangles depict three temporal-gap conditions. Colored circles signal the temporal gap (red, 0 ms; blue, 300 ms; yellow, 600 ms). Inner diameter lines take any of four possible orientations (shown in the upper right small rectangle). In this figure, the circles in red exemplify the false-alarm task condition whereas the circles in blue and yellow exemplify the no-change and change-task conditions respectively. Three extended arrows (bottom right) depict events times. A fixation point lasted 500 ms (gray). The animation onset time and the first circle onset time occurred simultaneously. The first circle moved towards the right-most circle (black part of the arrow) and stopped at the edge of the second circle. The red/blue/yellow segment of the arrow represents the temporal gap whose offset signals the second circle onset. The change-signal onset time (CSO) occurred 640 ms before the circles’ touching time.

