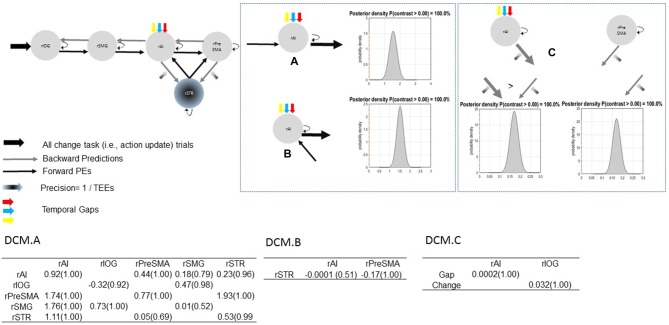
Figure 7.
Parameter estimates and PPs (yielded by Bayesian parameter averaging) of the winning model. Tables within the figure show parameter estimates (PPs in parentheses); dynamic causal modeling (DCM) DCM.A, matrix of endogenous connections; DCM.B, matrix of modulatory inputs; DCM.C, matrix of driving inputs. Parameters are not exponentiated. The winning model (top left). Contrast between strengths of rSMG→rAI and rAI→rPreSMA connections (A). Contrast between strengths of rSTR→rAI and rAI→rPreSMA connections (B). Contrast between modulatory effects of absolute TEEs on rAI→rSTR and on rPreSMA→rSTR connections (C). Arrow thickness depicts the relative parameter value or relative connection-strength value. Density plot represents the posterior density yielded by the contrast of interest.

