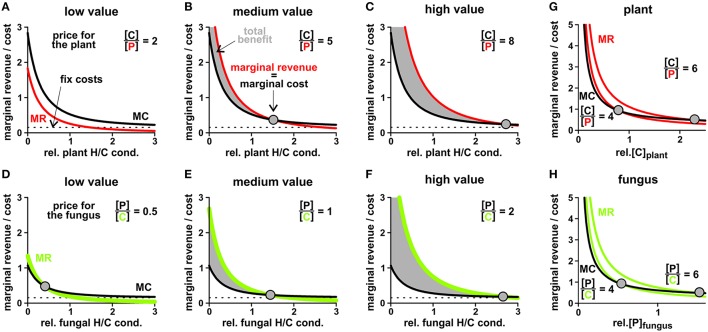
Figure 10.
Price-dependent economic optimisation of transporter activity and cytosolic concentrations. (A–C) Adjustment of the plant H/C-transporter activity in three different scenarios: the phosphate provided by the fungus is (A) of low value (1 P values 2 C for the plant), (B) medium value (C/P = 5) and (C) high value for the plant (C/P = 8). In all cases, the revenue of the plant in terms of delivered P increases (Figure 8), however, the marginal revenue (MR, red) decreases with increasing transporter activity (relative plant H/C conductance). The plant “pays” a carbon source and may have additional fix costs for the expression and maintenance of functional transporters (marginal cost curve, MC, black). The intersection of the MR with the MC curve indicates the point of economic equilibrium, at which the marginal revenue equals the marginal costs (dots). At a higher H/C-transporter activity the additional costs of the plant would be higher than its additional revenue, while at a lower activity the plant would not make maximal profit. Please note that in (A) the two curves do not intersect; the economical equilibrium is at zero, i.e. no plant H/C-transporter activity. (D–F) Adjustment of the fungal H/C-transporter activity in three different scenarios: the carbon source provided by the plant is (D) of low value (2 C values 1 P for the fungus), (E) medium value (P/C = 1) and (F) high value for the fungus (P/C = 2). The marginal revenues for the carbon source (MR, green) are compared with the marginal cost curve (MC, black) for phosphate and potential fix costs. (G,H) Price-dependent economic optimisation of nutrient supply. (G) Marginal cost = additional carbon/sugar release (MC, black) and marginal revenue = additional phosphate gain (MR, red) as a function of the cytosolic sugar ([C]) concentration in the plant for two different plant-specific C/P values. With increasing C/P value the economic equilibrium shifts to higher cytosolic [C] levels. (H) Marginal cost = additional phosphate release (MC, black) and marginal revenue = additional carbon/sugar gain (MR, green) as a function of the cytosolic phosphate ([P]) concentration in the fungus for two different fungus-specific P/C values. With increasing P/C value the economic equilibrium shifts to higher cytosolic [P] levels. Please note: The MC and MR curves do not have units as they are the first derivatives of the unit-less relative P- and C-fluxes plus the fix costs in case of MC. To be able to compare MR with MC their different “currencies” (C per time or P per time) were converted by the indicated conversion factor, which indicates the individual value for the respective organism.

