Figure 7.

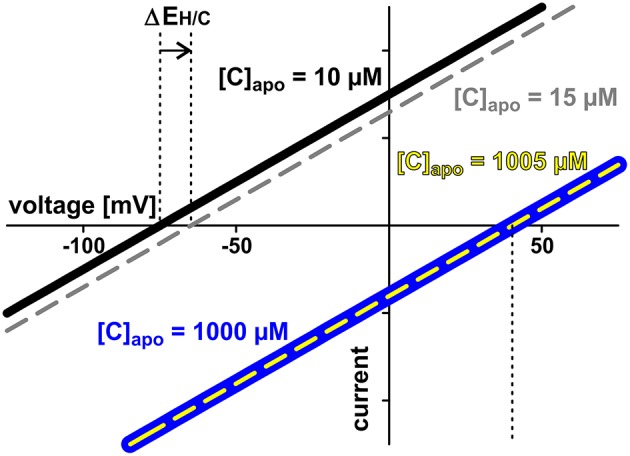
Low apoplastic concentrations facilitate sensing by proton-coupled transporters. Exemplarily the current voltage curves of a proton-coupled H/C-transporter are shown. The cytosolic sugar concentration is [C]cyt = 2 mM in all cases. Two cases are considered: In case 1 (black and gray curves) the apoplastic concentration is initially [C]apo = 10 μM (black). The increase by additional 5 μM shifts the current voltage characteristics to less negative voltages (ΔEH/C, gray, dashed). The transporter senses the 5 μM difference. The modified properties feedback on the entire transporter network. In case 2 (blue and yellow curves) the apoplastic concentration is initially [C]apo = 1000 μM (blue) and increase of the same magnitude (5 μM) does not change the current voltage characteristics (yellow). The transporter cannot sense the difference between [C]apo = 1000 μM and [C]apo = 1005 μM. There is no feedback of the concentration change to the transporter network.
