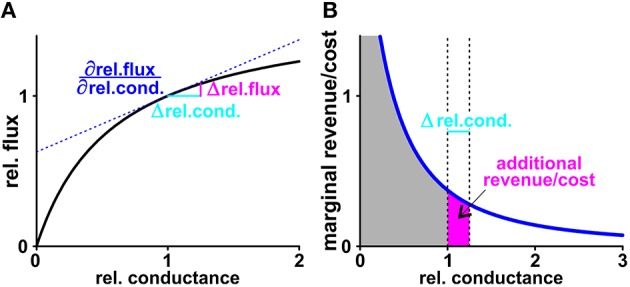
Figure 9.

Marginal revenue/marginal cost. (A) The black curve shows exemplarily the dependency of the normalized sugar flux on the normalized conductance of the plant H/C-transporter. The normalization process results in unit-less values: Doubling the conductance from = 200 fA/(μm2×V) to 400 fA/(μm2×V) is equivalent to a shift of the relative conductance from 1 to 2. This change increases the H/C-flux from 1.74 to 2.13 fA/μm2, which is equivalent to an increase in the relative flux from 1 to 1.22. If the rel.conductance changes by the small amount Δrel.cond. (light blue) there is an additional H/C-flux (Δrel.flux, magenta) from the plant. At the limit △ rel.cond. → 0 the additional flux can be calculated as △ rel.flux = △rel.cond. with the derivative of the black curve at the starting point (blue, dashed line). (B) The derivative of the black curve is the marginal cost curve (blue). The surface below the curve down to the axis (gray) indicates the total cost. For a small change Δrel.cond. (light blue) the additional surface (magenta) indicates the additional cost superimposed by this change. Calculations of marginal revenues are equivalent to the considerations for “costs” outlined here in detail.
