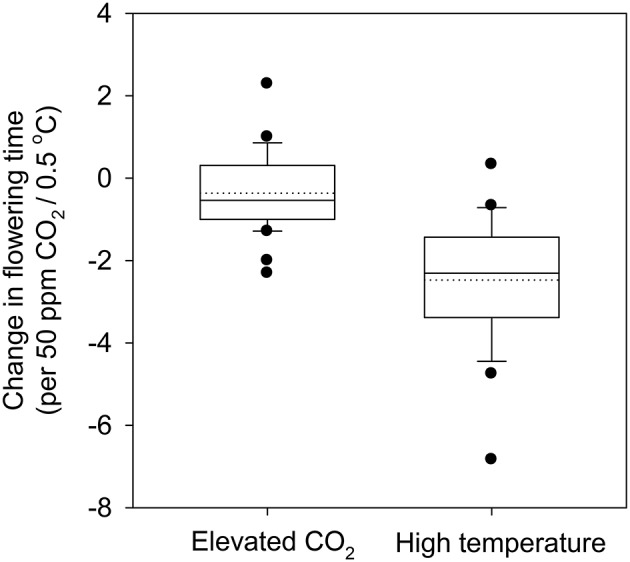
Figure 1.

Change in flowering time (days) in plants under elevated CO2 (per 50 ppm) and high temperature (per 0.5°C). The difference in CO2 concentration (elevated vs. ambient) was divided by 50 ppm to get a numerical unit for the total change in CO2 levels. Change in flowering time (days) was then divided by the previously obtained numerical unit to get change per 50 ppm. Similarly, change in temperature (high vs. ambient) was divided by 0.5 to get a numerical unit and change in flowering time (days) was divided by respective numerical unit associated with studies referenced in Table 1 and Table S1. The bottom and the top of the box represent the 25th and 75th percentile while the band near the middle represents the 50th percentile. The whiskers represent the 5th and the 95th percentile and the dots the outliers. References provided in Table 1 and Table S1.
