
Figure 6.
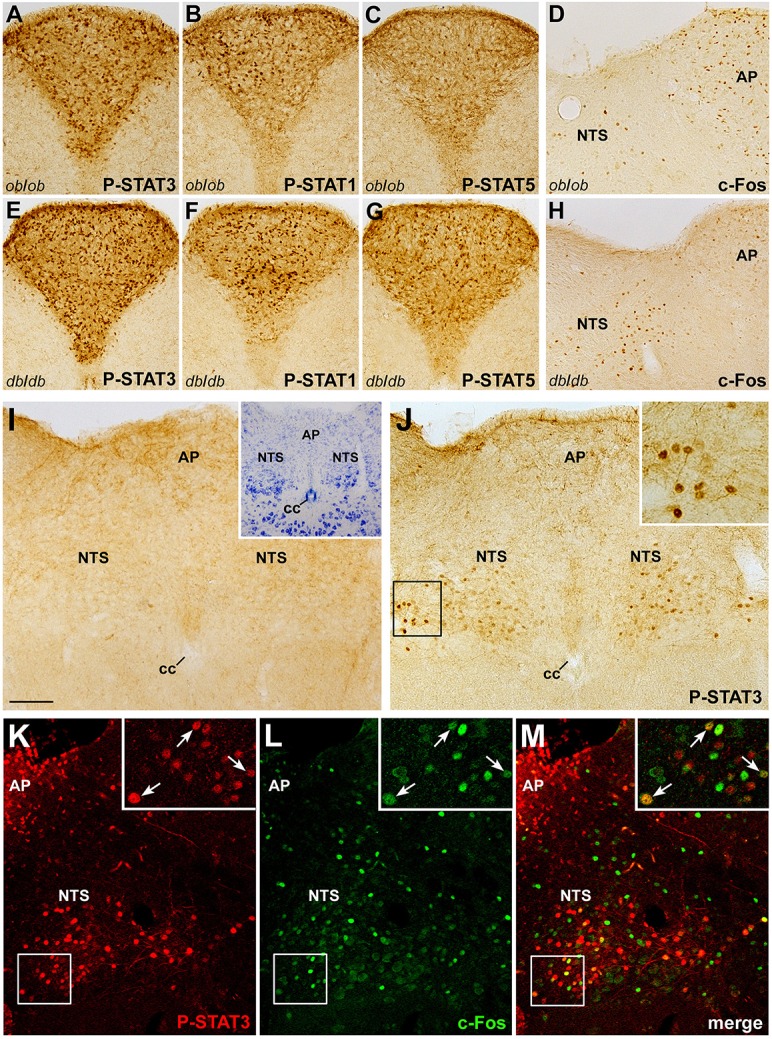
Relationship between CNTF and leptin signaling in the mouse brainstem. CNTF treatment for 45 min induced STAT3 (A,E), STAT1 (B,F), and STAT5 (C,G) phosphorylation in the area postrema of ob/ob (A–D) and db/db (E–H) obese mice and c-Fos expression (D,H) in the area postrema (AP) and solitary tract nucleus (NTS). Treatment with leptin for 25 min (J) activated STAT3 signaling in neurons and fibers in the caudal portion of the NTS, enlarged in the inset. (I) corresponding structures from a control mouse processed for P-STAT3 immunohistochemistry. Inset of I shows the adjacent Nissl-stained section. Double-staining and confocal microscopy experiments in a coronal brainstem section from a mouse treated for 120 min with CNTF to induce c-Fos expression and with leptin for 25 min to induce STAT3 activation (K–M) show some NTS neurons (enlarged in the insets, arrows) expressing both c-Fos and P-STAT3. Insets of (J) and (K–M) are enlargements of the corresponding framed areas. Bar:(A–C) and (E–G), 150 μm; (D, H–J,) and (K–M), 120 μm; insets of (J) and (K–M), 30 μm; inset of (I), 300 μm.