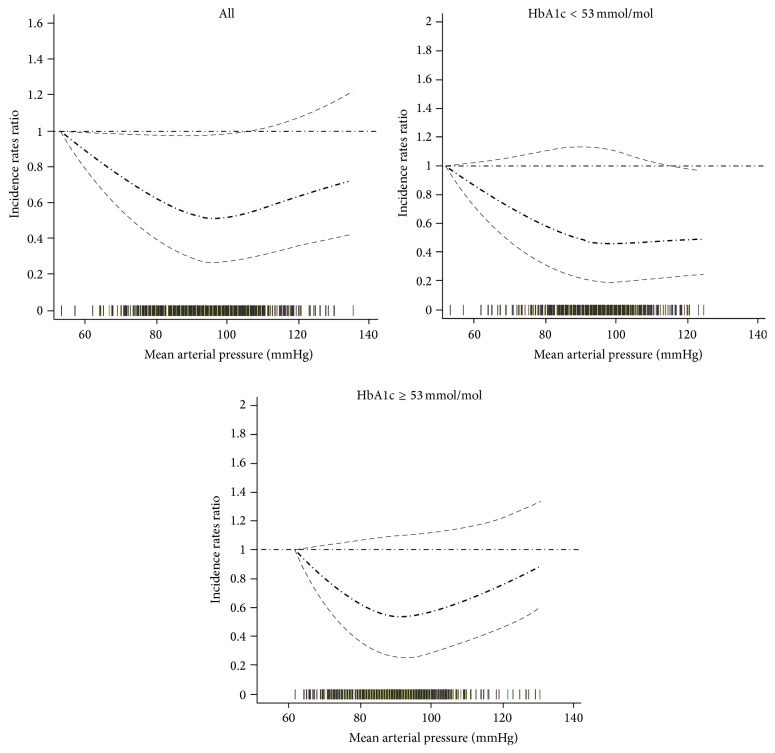
Figure 1.
Relationship between mean arterial pressure and cardiovascular hospital admission: analysis in full data range. Adjusted for prevalent recorded history of cardiovascular/cerebrovascular disease, duration of diabetes registration in GP practices, body mass index, triglyceride, total cholesterol, low density lipoprotein, high density lipoprotein, estimated glomerular filtration rate, smoking status, lipid-lowering treatment, aspirin treatment, and pulse pressure. The thick dash-dot line indicates the incidence rate ratio and the thin dash line indicates the 95% confidence interval. The rag plot (bars on the x-axis) presents the mean arterial pressure distribution.

