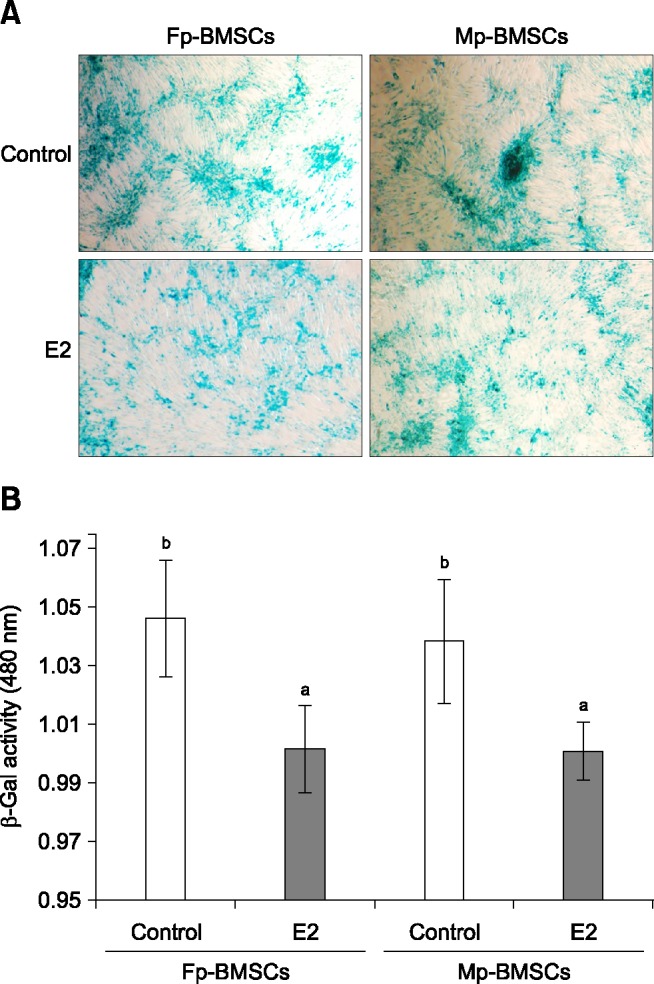
Fig. 3. Analysis of cellular senescence in Mp- and Fp-BMSCs following E2 supplementation using β-galactosidase (β-Gal) staining. (A) Detection of senescence-associated β-Gal staining of Mp- and Fp-BMSCs cultured in the control (0 M) and E2 (10-12 M). (B) Cell senescence was quantified in Mp- and Fp-BMSCs by measuring senescence-associated β-Gal staining at an absorbance of 405 nm. The white and black bars represent cells cultured in the control and E2, respectively. The different superscript letters represent significant (p < 0.05) differences. 200× (A).

