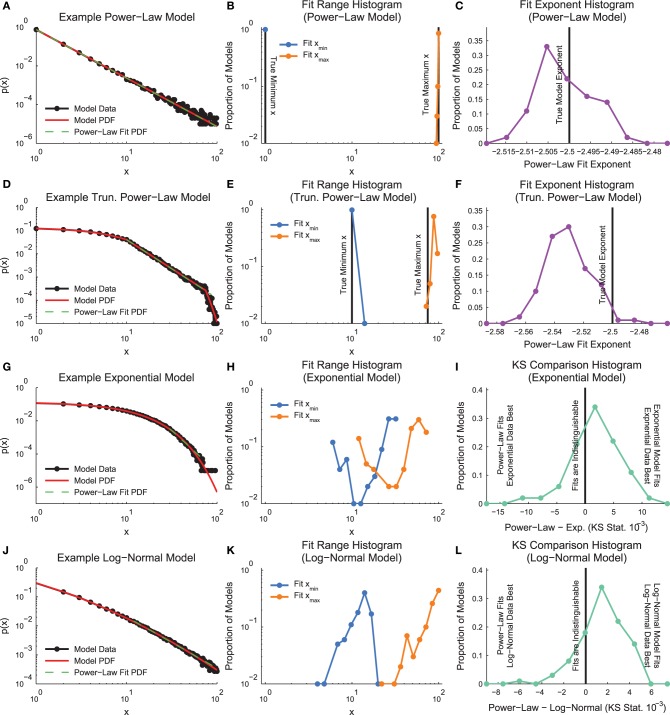
Figure 3.
Model distribution power-law fit results. (A, D, G, J) Example model distributions. Note that the truncated power-law search algorithm finds power-law segments of all four models. (B, E, H, K) Histograms of minimum and maximum power-law fit regions. Note that the fit method finds the power-law segment of the truncated power-law model, though it does tend to overestimate the fit range. (C,F) Histogram of fit exponents for the power-law and truncated power-law models. The fit finds the power-law exponent with very small error, but it tends to slightly underestimate the truncated power-law exponent (I,L) KS-statistic comparison between power-law fits and the real model. Note that for these fits, a large proportion of the data sets are better fit by a truncated power-law distribution than the non-power-law distribution that was used to generate the model data.

