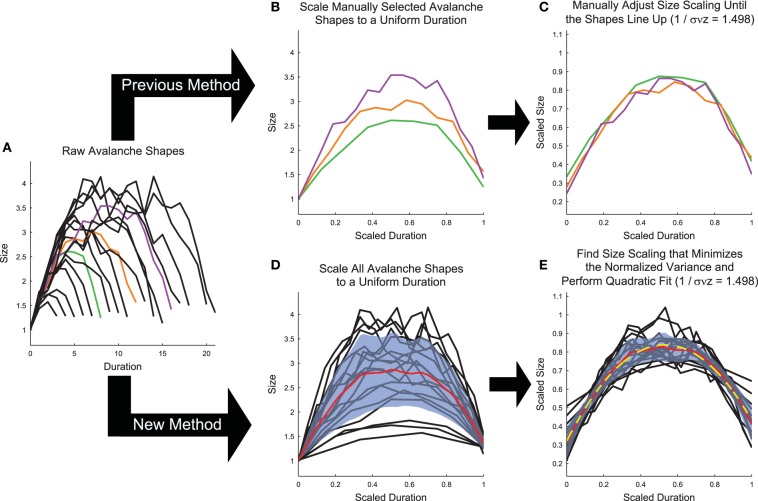
Figure 6.
Shape collapse calculation algorithm. (A) Raw avalanche shapes are found by averaging the profile of all avalanches with a given duration. Only durations longer than three and with at least 20 examples were analyzed. In previous analyses (Friedman et al., 2012), (B) three avalanches are manually selected and scaled to uniform length (colors correspond to unscaled avalanches in A), then (C) the scaling parameter is manually adjusted until the shapes line up (Note, the same scaling is used in C,E). In the new method introduced herein, (D) all of the avalanches are scaled to a uniform length, each avalanche is linearly interpolated at 1000 points, and the variance is calculated (Standard deviation (blue fringe) shown instead of variance to make the error visible). (E) Then, the scaling parameter is found that minimizes the variance and the avalanches are fit (yellow dashed line) using a quadratic polynomial. Note, using the shape collapse analysis, we found 1∕σνz = 1.498. Using the average size given duration fit, we found 1∕σνz = 1.503 (Figure 5). This represents a difference of 0.3%. The data for this explanatory figure was taken from the cortical branching model.

