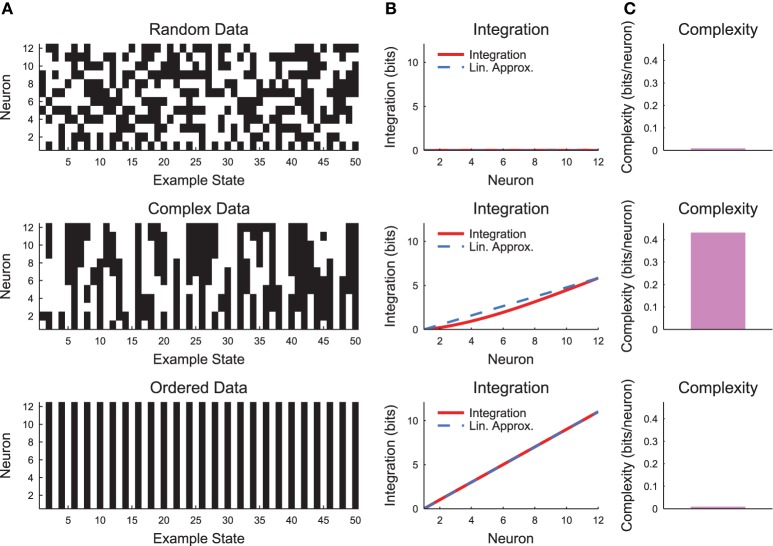
Figure 7.
Neural complexity. (A) Short segments of example spike rasters for three types of chain model data [see Section 2.3, c = 0 (random), c = 0.8 (complex), c = 1 (ordered)]. (B) Integration curves with linear approximations for different subset sizes. Note that random data shows no integration, while ordered data shows high integration. Complex data shows high integration that varies non-linearly with subset size. (C) Complexity values. Only the complex data shows non-zero complexity.

