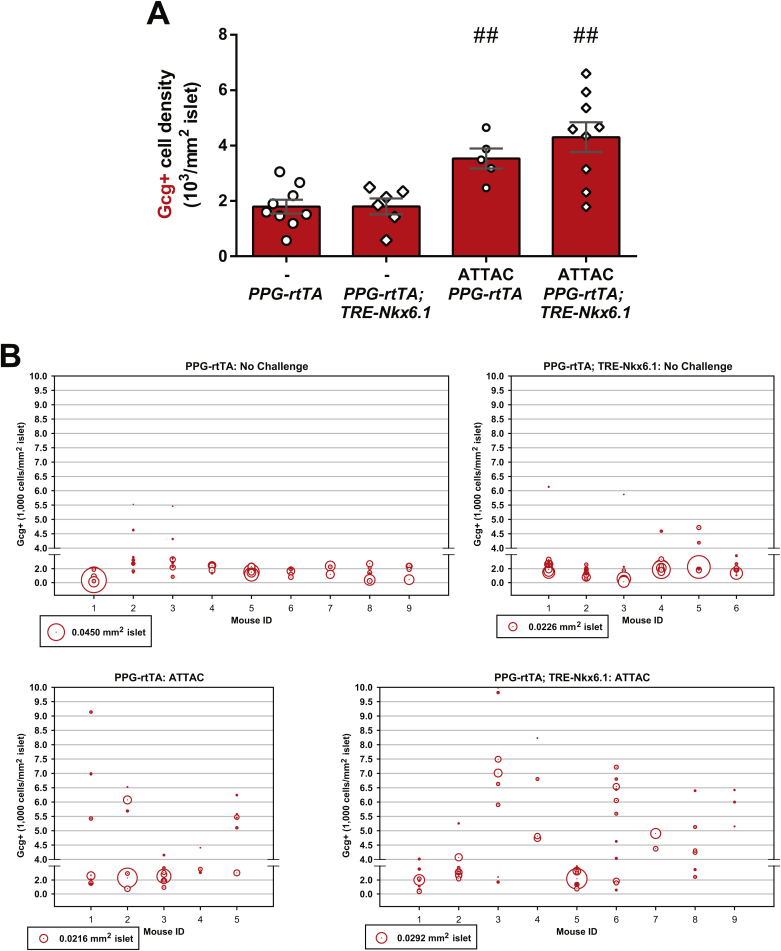
Figure S13.
Quantitation of α-cells in [PPG-rtTA; TRE-Nkx6.1] mice. PPG-rtTA and [PPG-rtTA; TRE-Nkx6.1] mice were fed on doxycycline diet for 1 week. [PPG-rtTA; PANIC-ATTAC] and [PPG-rtTA; TRE-Nkx6.1; PANIC-ATTAC] mice were subjected to dimerizer-induced β-cell apoptosis (ATTAC) and, 2 weeks later, doxycycline diet regimen for another week. Pancreas sections were subjected to immunofluorescence of glucagon and insulin. (A) Every mouse was counted for the total number of glucagon+ cells, and normalized against the total islet area. Data are presented as mean ± SEM. Dots: individual mice. ##P < 0.01 versus the no challenge control, by unpaired t-test. (B) The examined islets of individual mice are plotted as circles, which area represents the islet size, and the center position marks the density of glucagon+ cells in the islet.

