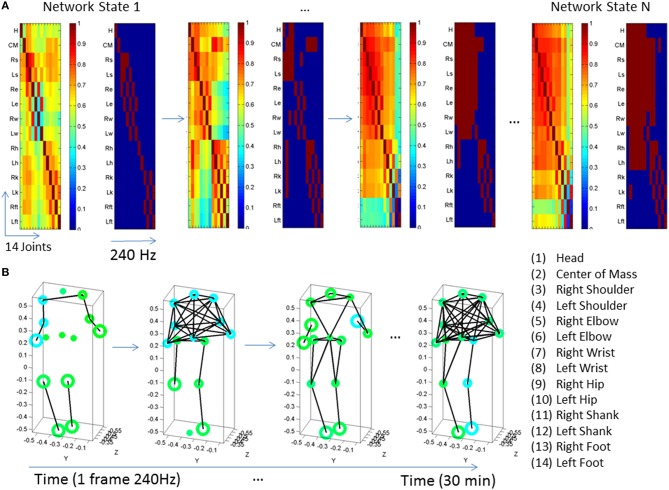
Figure 3.
Visualization of dynamic states of the peripheral network connectivity across 14 joints of the body. (A) PLV and binary matrices (at 0.85 threshold) showing individual frames from a representative PMS participant. (B) Network representation of peripheral joints (nodes) and links (edges) between highly synchronized joints. Circles represent joints and lines are active links within a frame corresponding to highly synchronized joints within a ½h period taken in frames of 240 Hz each. The size of the circle represents a measure of node neighbor-clustering (see text for details). The color of the circle is based on the modularity metric (see text for details). Circles with the same color represent modules of nodes that maximize the number of within-group edges, and minimize the number of between-group edges, i.e., a modular community structure within the network.

