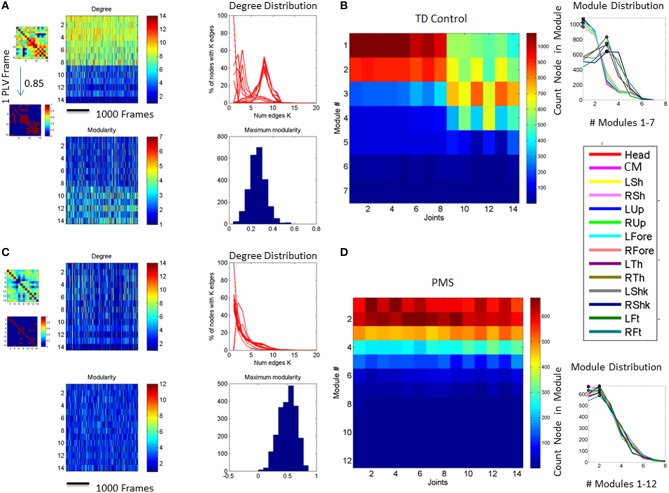
Figure 4.
Network of 14 joints dynamically unfolding in time with self-emerging synergies. (A) Connectivity matrix 14 joints × 16 s (4000 frames at 240 Hz) from representative control. One frame of the full and the corresponding binary PLV (determined at a 0.85 threshold) are shown as insets. Color bar represents the connectivity. The network has 14 nodes (the 14 joints in the legend of Figure 3 where the center of mass is estimated from thorax and lumbar sensors located as 2 and 3 in the trunk of the avatar in Figure 1) for two representative subjects, one from the typical control group (A,B) and one from the PMS group (C,D). The degree distributions of the network and the modularity distributions are obtained from a 30 min walk registering fluctuations at 240 Hz. Notice the contrast between the two representative participants. (A) also shows on the left the full and binary PLV matrices of one frame at a 0.85 threshold (high synchronicity). In the 14 joints × time (frames) matrix each entry provides the degree for each node (joint) as reflected in the color bar. There is higher connectivity in the upper body (numbers 1–14 are as in legend of Figure 3) than in the lower body for this typical participant. The degree distribution of the network for a segment of the 30 min walk is also shown on the right-top panel. Notice that the curves represent the degree distribution of the joints and that a pattern emerges corresponding to the upper and lower body as well. Specifically the upper body has distributions centered farther to the right, with higher number of links than the lower body. The lower body has more nodes with fewer links and fewer “hub” nodes (in the tail of the distribution). Notice that the upper body has higher connectivity than the lower body in this participant (joints are as in the legend of Figure 3). Degree distribution identifies two distinct groups of nodes. Corresponding modularity matrix identifies up to 7 modules (color bar). Frequency histogram of maximal modularity is also shown. (B) Matrix quantifying the joint participation per module (color bar shows the counts). Inset shows the module distribution with identification of modules with maximal count per joint participation. Two modules self-emerge (1 and 3) as the ones with maximal joint participation denoting two main synergies summarizing the complex 14 joint patterns of the gait in this participant. Colors in the legend identify the joints participating in the two synergies. Notice that one contains the upper body joints and the other the lower-body joints, consistent with the degree distribution in (A). (C,D) The same information as in (A,B) is shown for a PMS participant. Notice the striking differences with the control and the lack of synergies in the PMS case.

