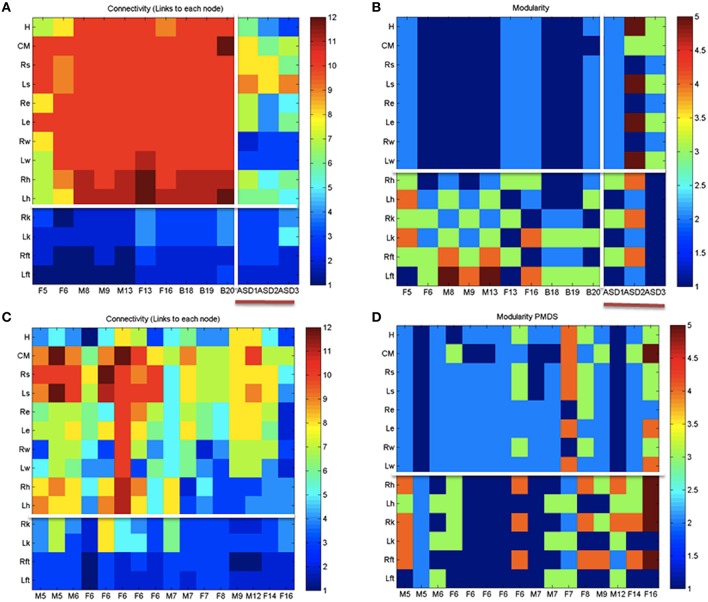
Figure 8.
Indexes of peripheral network connectivity and modularity across subjects. (A) Summary patterns for controls and the 3 iASD participants. Each column represents a participant's pattern of network connectivity from low (blue) to high (red) degree of connectivity. The last three columns separated by the vertical white line are the 3 iASD (9–12 years old with connectivity patterns close to the 5 year old in the first column). Labels in the column axis are sex-age (e.g., F5 means female 5 years old). Each row represents 1 of 14 joints across the body as in Figure 4 legend. Above the white line are head, center of mass, right shoulder, left shoulder, right elbow, left elbow, right wrist, left wrist, right hip, and left hip. Below the white line are right knee, left knee, right ankle, left ankle. (B) Average modularity index taken across the 30 min walk for control subjects (last 3 columns are the iASD). Horizontal line divides the upper body from the lower body. (C) Summary connectivity matrix for PMS children. (D) Summary modularity matrix for the PMS children.

