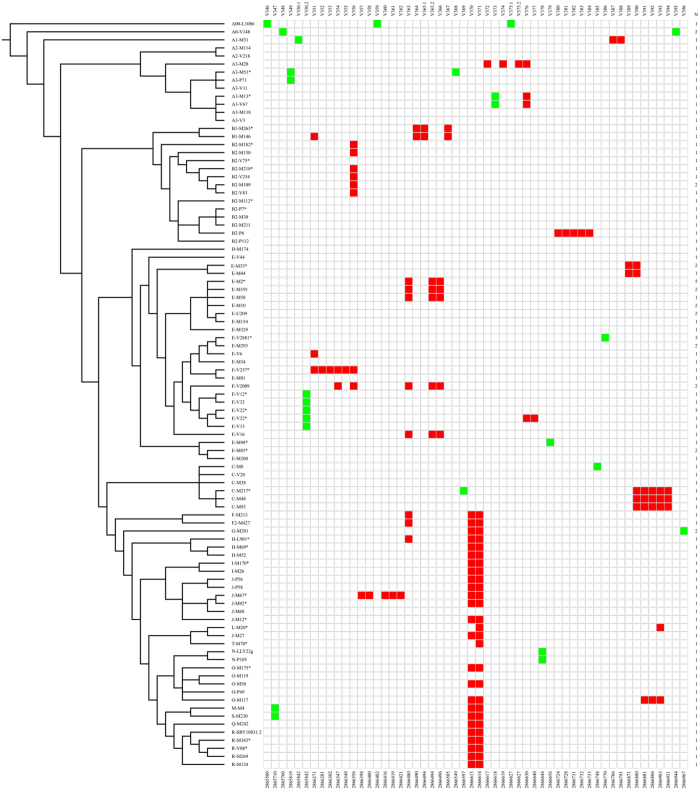
Figure 3. SNPs identified in LTR 2.
To the left, a simplified version of the Y-chromosome tree showing the phylogenetic relationships of the Y chromosomes sequenced. The names and position of the SNPs are given at the top and at the bottom, respectively. Square colours represent the allelic state for each SNP: White, ancestral allele; red, closely spaced SNPs arisen on the same branch of the Y phylogeny; green, «conventional» SNPs. N represents the number of Y chromosomes sequenced for each of the haplogroups shown to the left; when N > 1, chromosomes belonging to different subhaplogroups were chosen.

