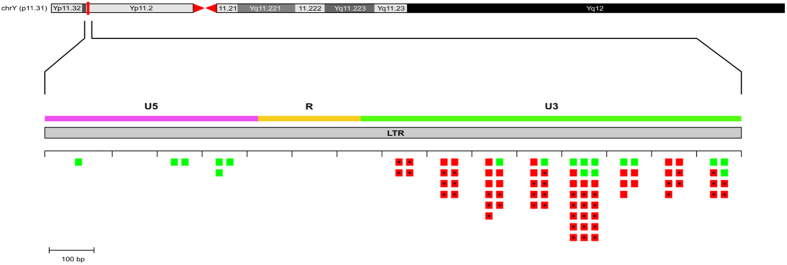
Figure 4. Locations of observed mutational events in the LTR 2 element.
Each mutational event is represented by a square placed in the correct 100 bp segment of the element. Green square: conventional SNPs. Red square: clustered SNPs. Square with the dot represents recurrent mutational events. The boundaries of the functional domains of the element are approximate.

