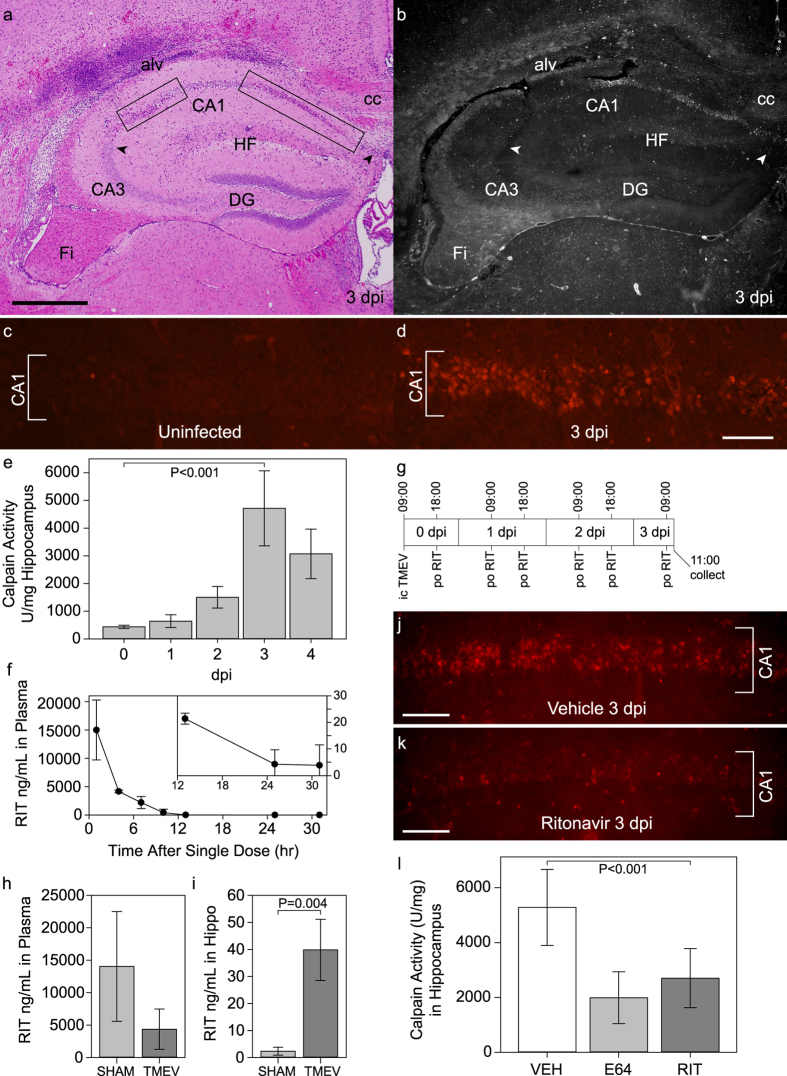
Figure 1. Calpain activation in CA1 hippocampal neurons during acute infection is inhibited by ritonavir treatment.
(a) At 3 days postinfection (dpi) the CA1 hippocampal pyramidal neuron layer is marked by pyknotic nuclei (rectangular outlines); CA3 and dentate gyrus (DG) neurons are spared. Image is representative of greater than 30 individual animals. (b) In situ calpain zymography on a tissue section adjacent to (a) shows that calpain activity (white) is largely restricted to the CA1 layer at 3 dpi. Image is representative of 10 mice. (c) While no calpain activity is detected in CA1 neurons in uninfected mice, (d) robust calpain activity (red) is observed in CA1 neurons at 3 dpi. Images are representative of 10 mice per condition. (e) 3 dpi is the peak for calpain activity in the hippocampus as measured biochemically; P < 0.001 by one-way ANOVA; SNK pairwise analysis indicates all timepoints are different from one another, with 3 dpi vs uninfected at P < 0.001; n = 5 mice per timepoint. (f) Mice were treated by oral gavage with a single dose of the pharmaceutical formulation of ritonavir and levels of the drug in plasma were measured by HPLC over 31 hrs; n = 3 mice. (g) Schematic of the multiple dosing regimen used for (h,i). At 3 dpi ritonavir was detected in plasma (h) and in hippocampal lysates (i). Levels were elevated in the hippocampus in TMEV-infected mice as compared to sham-infected; P = 0.004; n = 5 mice per group. (j) Vehicle-treated mice showed high calpain activity in CA1 neurons at 3 dpi (compare to d); ritonavir robustly suppressed calpain activity in these cells (k). Images are representative of 5 mice per group. (l) Oral ritonavir was as effective as E64 at suppressing hippocampal calpain activity at 3 dpi (P < 0.001 between all groups by one-way ANOVA; SNK pairwise: vehicle vs RIT, P < 0.001; E64 vs RIT, P = 0.110); n = 5 mice per group. alv = alveus; cc = corpus callosum; Fi = fimbria/fornix; HF = hippocampal fissure. Scale bar in (a) is 500 μm and refers to (b) scale bar in (d) is 100 μm and refers to (c) scale bars in (j) and (k) are 100 μm. Graphs show means ± 95% confidence intervals.

