Figure 5.

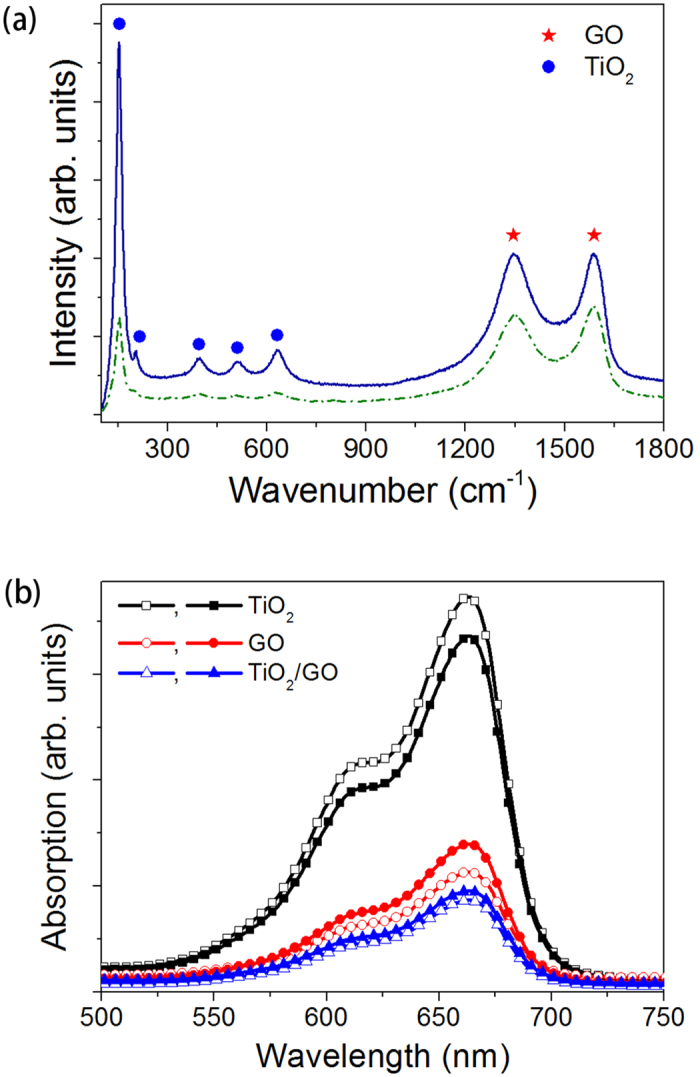
(a) Raman Spectra of TiO2/GO before (dash line) and after (solid line) photocatalysis reaction; (b) absorption spectra of 30 μM MB solution immersed with as-prepared (hollow symbol) and used (solid symbol) photocatalysts for 50 min.

(a) Raman Spectra of TiO2/GO before (dash line) and after (solid line) photocatalysis reaction; (b) absorption spectra of 30 μM MB solution immersed with as-prepared (hollow symbol) and used (solid symbol) photocatalysts for 50 min.