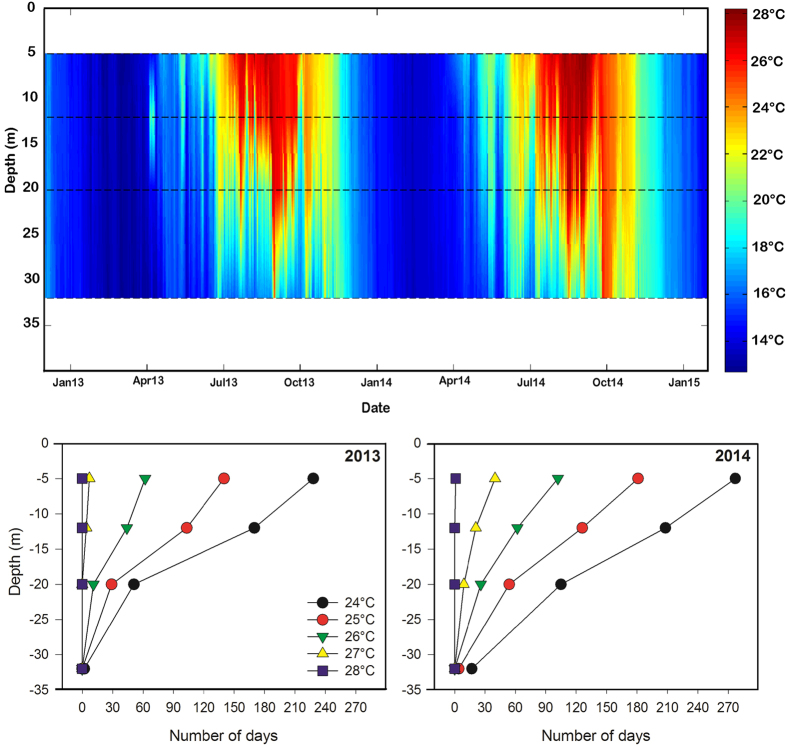
Figure 1. Water column temperature.
Temperature registered along 2013 and 2014 in the sampled meadow (upper panel). Dashed lines represent the depth at which sensors were installed (i.e. 5, 12, 20 and 32 m). Number of days in 2013 and 2014 above a given temperature (i.e. from 24 to 28 °C) at the depths at which temperature sensors were installed (lower panels).

