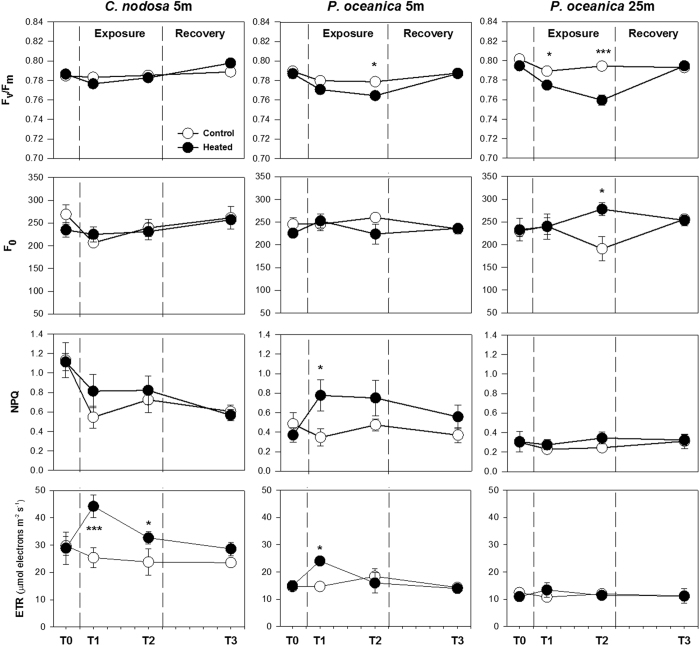
Figure 3. Chlorophyll a fluorescence parameters.
Maximum photochemical efficiency of PSII (Fv/Fm; top), basal fluorescence (F0; second), thermal energy dissipation (NPQ; third) and electron transport rate (ETR; bottom) of shallow C. nodosa (left) and P. oceanica (centre) and deep P. oceanica (right) from the control (⚪) and heat stress (⚫) treatments along the course of the experiment. Bars represent SE± n = 4. Asterisks indicate significant treatment effects as identified in the post-hoc analysis. *p < 0.05; **p > 0.01; ***p < 0.001.

