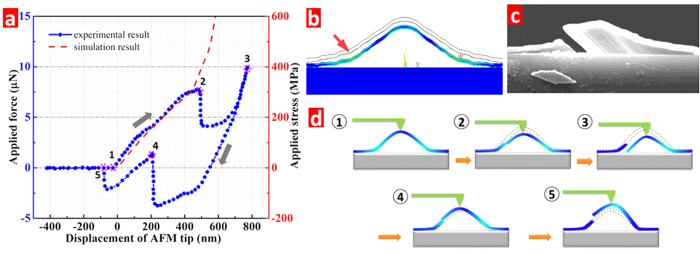
Figure 7.
(a) The displacement versus applied force curves of the experimental result using the AFM tip, and simulation result using FEA method for the arch microstructure, (b) stress distribution inside the arch structure and the red arrow shows the maximum stress point, SEM image with incline viewing angle after the loading and unloading cycle (c), and (d) illustrations of the arch structure corresponding to those loading and unloading points in panel (a).

