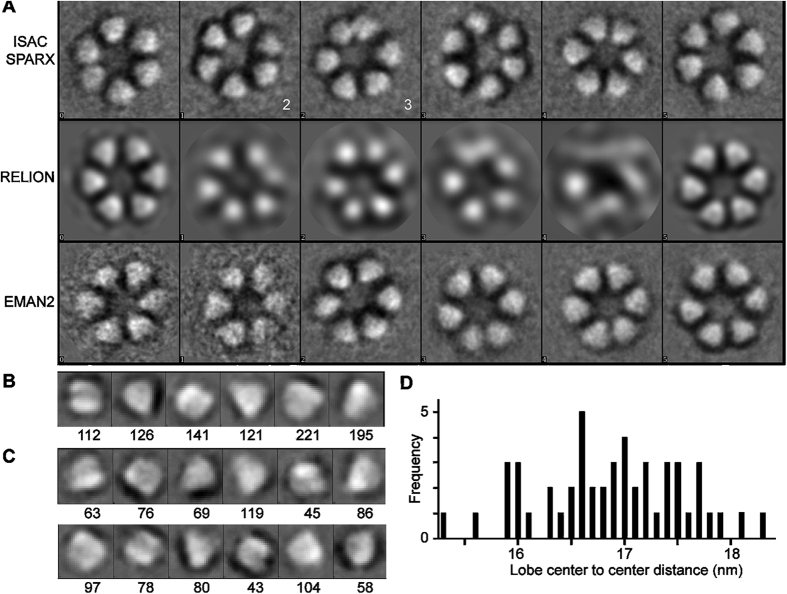
Figure 3. Class averages of rosette CSCs and individual lobes imaged by FF-TEM.
(A) Class averages of entire rosette CSCs as derived from the three programs named on the left of each row. The white lobes arose from reversal of the original image contrast before averaging. ISAC/SPARX class average 2 was used for further comparisons because the spacing of its opposite lobes matched the average shown in (D). ISAC/SPARX class average 3 shows two lobes close together at the top of the image. ISAC/SPARX gave 6 class averages, so the programs RELION and EMAN2 were also set to provide 6 classes. Each side of the box containing a rosette CSC = 31.6 nm. (B) Six or (C) 12 class averages as derived by EMAN2 from individual lobes are shown, with the number of lobes in each class indicated below each panel. Each side of the box containing a lobe = 10.6 nm. (D) The distribution of center-to-center distances between opposite lobes in the class averages of the rosette CSCs in (A).

