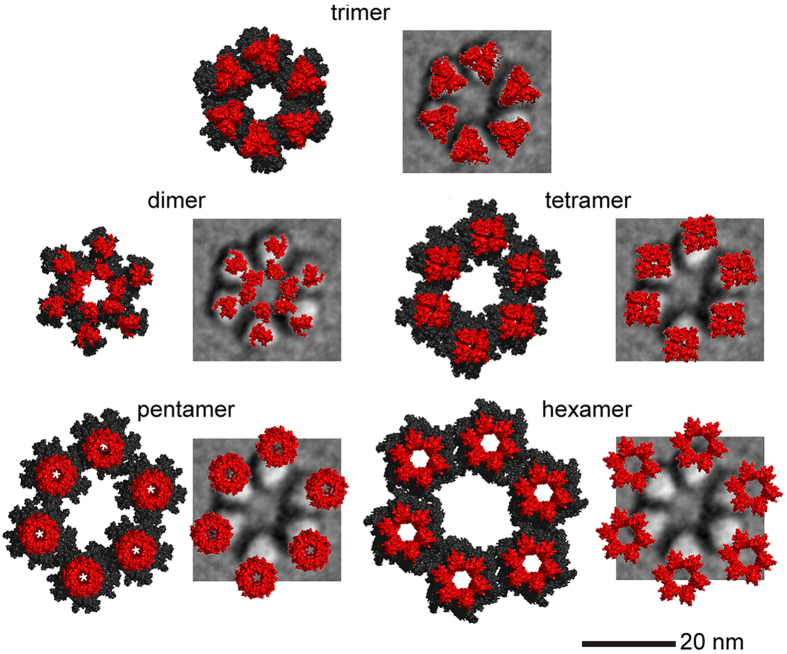
Figure 5. Computational predictions of the various oligomers of the putative 7 TMH CESA model and spatial comparisons to the rosette CSC.
In this analysis, seven TMH and the large catalytic/cytosolic domain were included in the model, and the oligomers were refined in MD simulations. All views are ‘top down’, from outside the cell. For each modeled oligomer (see labels in the figure), the left member of the pair shows the catalytic/cytosolic domain in black and the TMH in red. The right member of the pair shows only the TMH region overlaid on the ISAC/SPARX class average 2 image of the rosette CSC. The six-fold assembly of the trimeric TMH has the best fit with both the diameter and triangular lobe shape of the FF-TEM average image. The 20 nm scale bar applies to all images.

