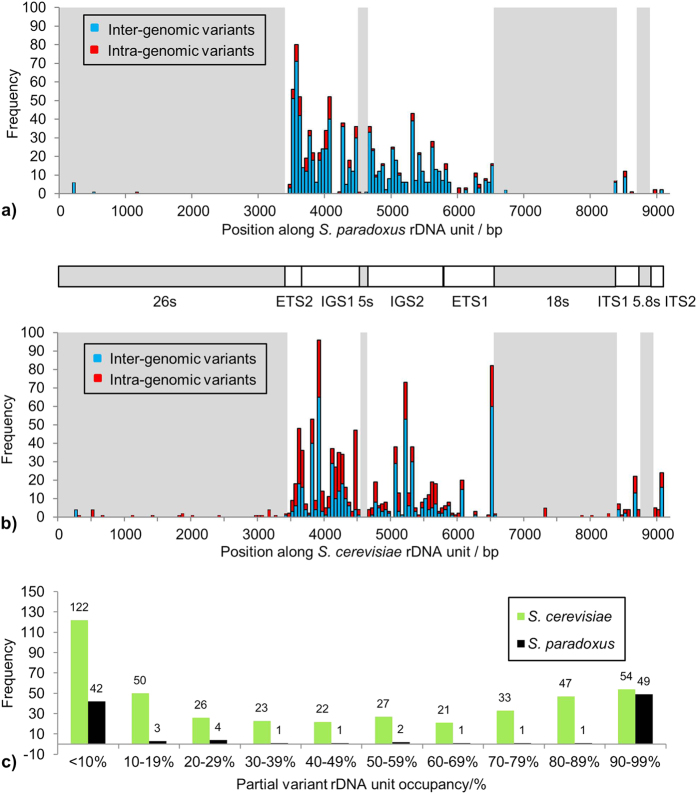
Figure 3. Distribution of Sequence Variation Along the rDNA Unit.
The distribution of rDNA sequence variants within the rDNA unit and their unit occupancy frequencies along the tandem array. (a) Inter- and intra-genomic variants within the S. paradoxus dataset; fixed, inter-genomic variants (SNPs + INSs + DELs) are shown as blue bars while partial, intra-genomic variants (pSNPs + pINSs + pDELs) along with complex variants are shown as red bars, with the boxed areas in light grey highlighting coding RNA regions. Representation of an rDNA unit is shown below. Most variation is identified in the ETS2, IGS1 and IGS2 regions. (b) Inter- and intra-genomic variants within the S. cerevisiae dataset; data represented as in (a). Most variation is identified in the IGS1, IGS2 and ETS1 regions. (c) Bar chart showing unit occupancies of most intra-genomic variants (pSNPs + Type 1 pINSs + Type 1 pDELs) in the S. paradoxus and S. cerevisiae datasets, in unit occupancy bins of size 10%. Though both exhibiting U-shaped curves, the variant occupancy distributions for S. cerevisiae and S. paradoxus are markedly different.

