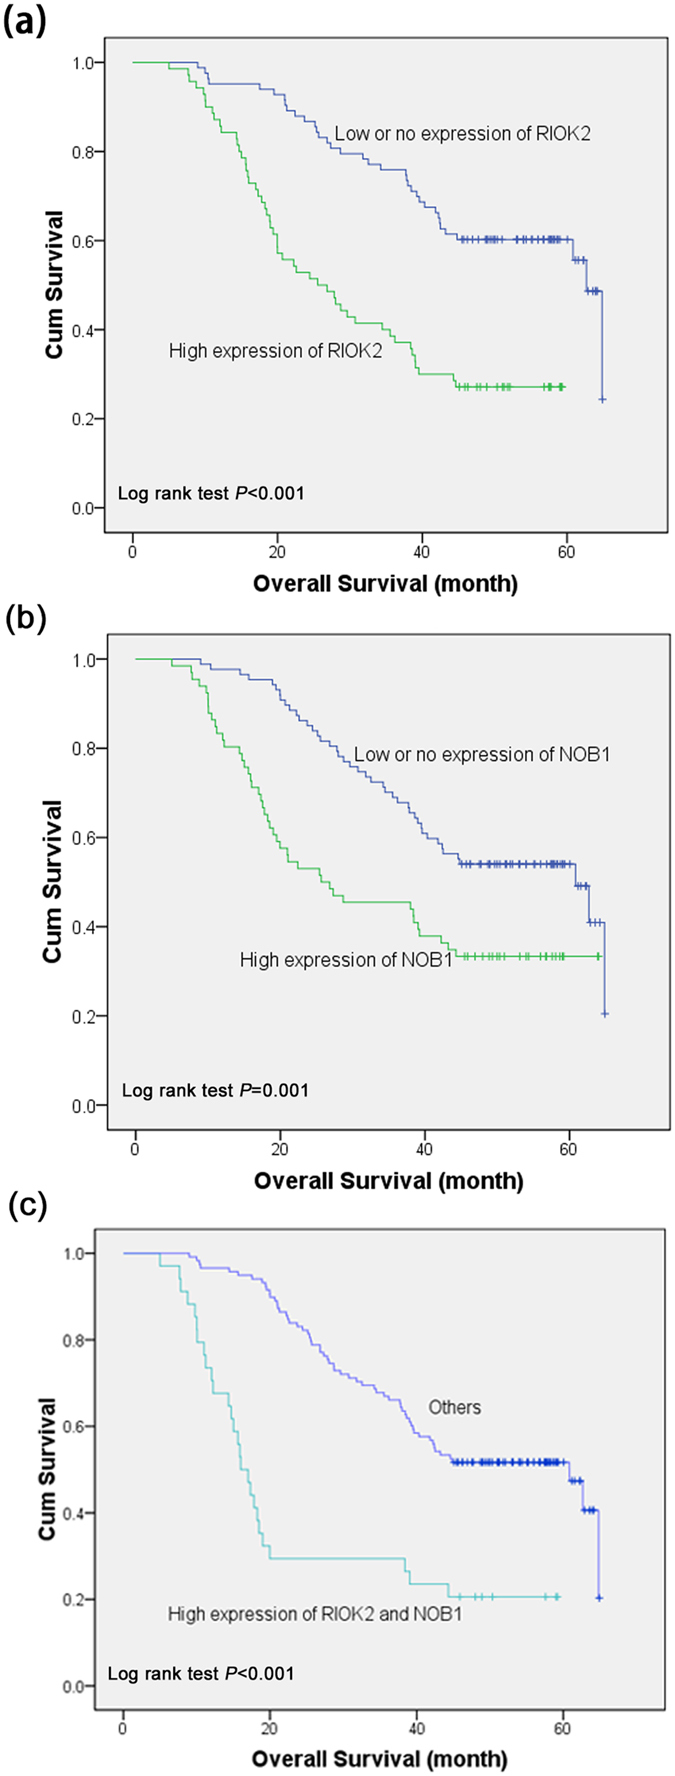
Figure 5. Kaplan-Meier survival curves for the cumulative (cum) overall survival according to the log rank test.

(a) The overall survival rate of the NSCLC patients with high RIOK2 expression (green line) was significantly lower than that of the patients with low or no expression (blue line). (b) The overall survival rate of the NSCLC patients with high NOB1 expression (green line) was significantly lower than that of the patients with low or no expression (blue line). (c) The overall survival rate of the NSCLC patients with high RIOK2 and NOB1 expression (green line) was significantly lower than that of the patients with low or no expression or single high RIOK2 or NOB1 expression (blue line).
