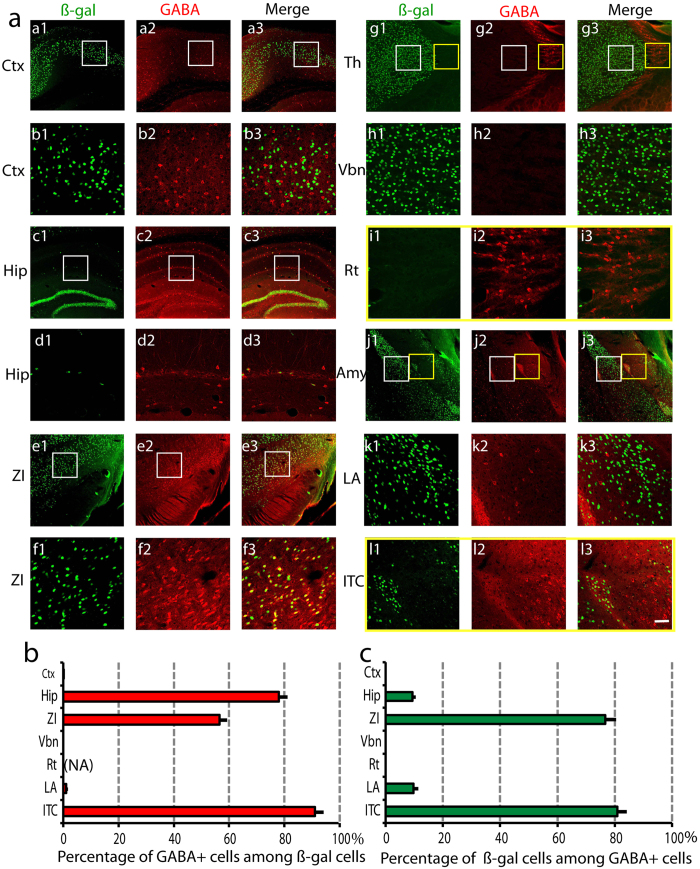
Figure 5. Netrin-G1 expression in inhibitory neurons.
(a) Coronal sections containing different brain regions were co-immunostained with antibodies against ß-gal (1: green) and GABA (2: red), and colocalization was observed (3: green + red). (a1–a3) represent cortex (Ctx) and (b1–b3) are higher magnified images of the areas indicated by the white boxes in a1–a3. (c1–c3) represent hippocampus (Hip) and (d1–d3) are higher magnified images (white boxes in c1–c3). (e1–e3) represent zona incerta (ZI) and (f1–f3) are higher magnified images (white boxes in e1–e3). (g1–g3) represent thalamus and (h1–h3) and (i1–i3) are higher magnified images from Vbn (white boxes in g1–g3) and reticular nucleus (Rt; yellow boxes in g1–g3). (j1–j3) represent amygdala, (k1–k3) and (l1–l3) are higher magnified images from LA (white boxes in j1–j3) and the dorsal intercalated cluster (ITC; yellow boxes in j1–j3). Scale bar: 120 μm (a,c,e,g,j); 30 μm (b,d,f,h,i,k,l). (b) Mean percentage of GABA-positive cells among ß-gal-positive cells for each ROI was calculated (n = 16, 4 animals × 4 sections). NA represents “not applicable”, because there is no ß-gal positive cell in Rt and 0 cannot be a denominator. (c) Mean percentage of ß-gal-positive cells among GABA-positive cells for each ROI was calculated (n = 16, 4 animals × 4 sections). We analyzed a total of 3340 (Ctx), 924 (Hip), 1779 (ZI), 6972 (Tha), 5228 (LA), and 976 (ITC) cells.

