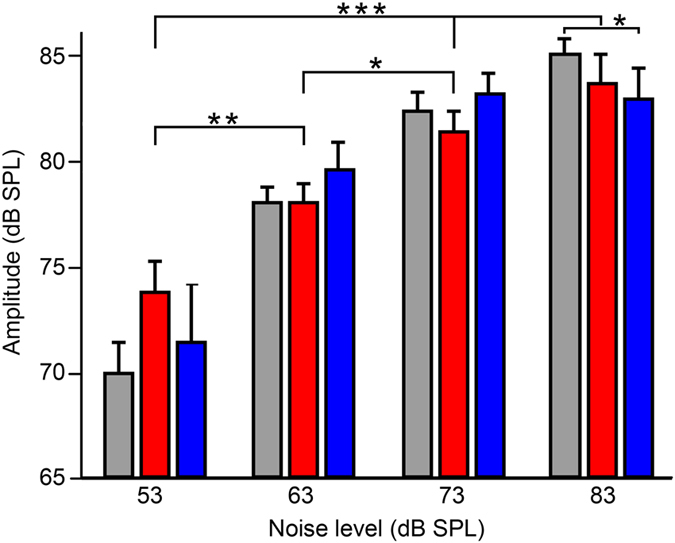
Figure 5. The Lombard effect occurred in males of O. tormota.

The amplitudes of both ASs and SSCs increased significantly as the level of noise exposure increased from 53 to 83 dB SPL (red: n = 22, 66, 51, and 11 males, respectively, for noise level group of 53, 63, 73, and 83 dB SPL for CF-type ASs; blue: n = 4, 33, 24, and 8 males, respectively, for noise level group of 53, 63, 73, and 83 dB SPL for FM-type ASs; gray: n = 41, 41, 32, and 5 males, respectively, for noise level group of 53, 63, 73, and 83 dB SPL for SSCs; ***P < 0.001; **P < 0.01; *P < 0.05). The results are means + s.e.m. Error bars for the panel indicate s.e.m.
