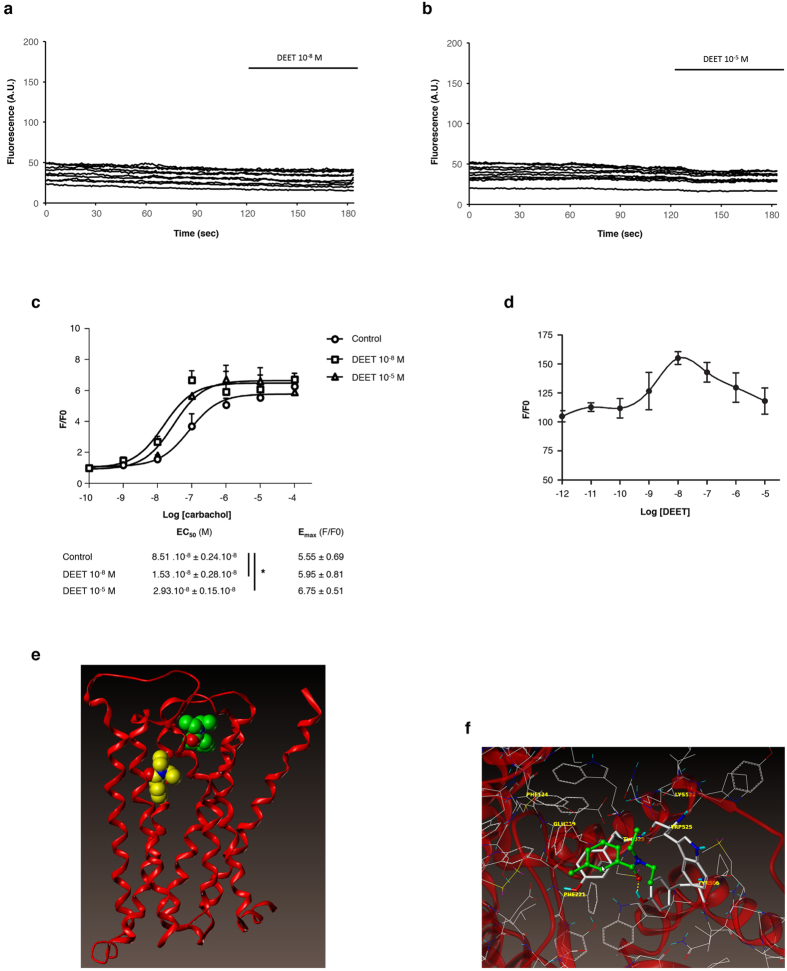
Figure 4. DEET is a modulator of M3 receptor.
(a,b) Time course of the fluorescence of 10 HEK/M3 cells loaded with fluo-4. DEET does not increase the fluorescence at the two used concentrations. (c) Concentration-response curves of different carbachol independent concentrations on [Ca2+]i increase on HEK/M3 in presence or in absence of DEET (10−8 M or 10−5 M). The peak response of [Ca2+]i induced by each agonist concentration is normalized in fold (F/F0). Each dot in the curve represents the mean ± SEM of three to six independent experiments. *p < 0.05 compared to control (ANOVA). (d) Modulation of the Ca2+ response in HEK/M3 induced by EC50 of carbachol (10−8 M) versus the concentration of DEET. This response is increased for 10−8 M of DEET. (e) M3 backbone is represented in red ribbon. Red balls correspond to oxygen atoms and blue ones to nitrogen. Carbon atoms are in yellow for DEET docked into the orthosteric site and in green for DEET docked into the allosteric site. (f) DEET in the putative allosteric site. Carbon atoms are in white for the protein and green for DEET; nitrogen are in blue, oxygen in red, sulfur in yellow and hydrogen in cyan. DEET is displayed in ball and stick fashion and residues of M3 interacting directly with DEET are highlighted in stick fashion. Dash yellow lines correspond hydrogen bonds.

