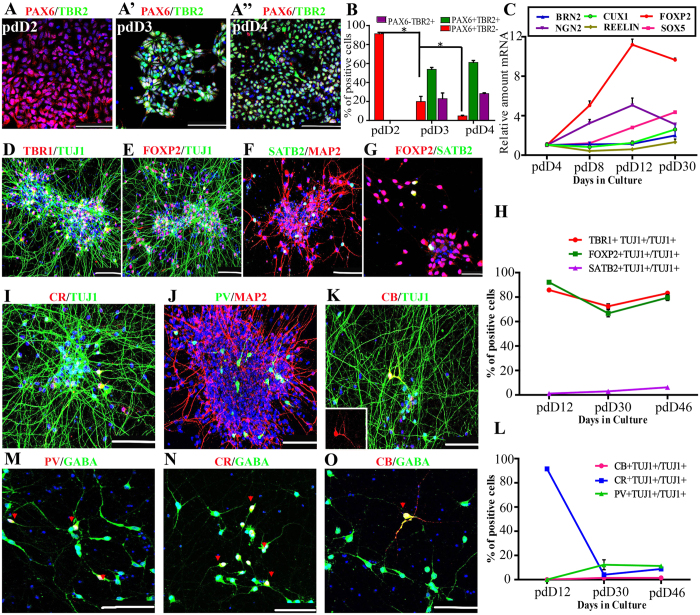
Figure 3. Neuroepithelial stem cells (NESCs) give rise to highly enriched CfuPNs along with a few interneurons.
(A–A”) NESCs underwent the progression of Pax6+ Tbr2− NESCs at pdD2 (A), Pax6+ Tbr2+ RGPCs at pdD3 (A’) and Pax6−Tbr2+ intermediate progenitors at pdD4 (A”) before neurogenesis after spontaneous differentiation, respectively. (B) Quantification of TBR2 and PAX6 positive cells during neurogenesis. Data expressed as mean ± s.d (n = 3) (*P < 0.05). (C) qRT-PCR data show the expression dynamics of apical cortical progenitors’ marker NGN2 and transcription factors specific for corticogenesis. (D,E) NESCs give rise to TBR1+ and FOXP2+ CfuPNs at pdD46. (F,G) NESCs give rise to a few SATB2+ FOXP2+ layer V callosal neurons at pdD28 (one subtype of CfuPNs). (H) Quantification of projection neurons corresponding to cortical deep layers during the differentiation course indicated by immunofluorescence staining, respectively. Data expressed as mean ± s.d. (I–K) Three subtypes of interneurons generated from NESCs at pdD46. CR: CALRETININ; PV: PARVALBUMIN; CB: CALBINDIN. (L) Quantification of three subtypes of interneurons during corticogenesis, respectively. Data expressed as mean ± s.d. (M–O) Some representative PV- (M), CR-(N), CB-(O) with GABA double positive inhibitory interneurons in the differentiated cells from NESCs at pdD35. Red arrows indicate double positive neurons. Scale bars: 10 μm. Blue: DAPI, nuclear stain.

