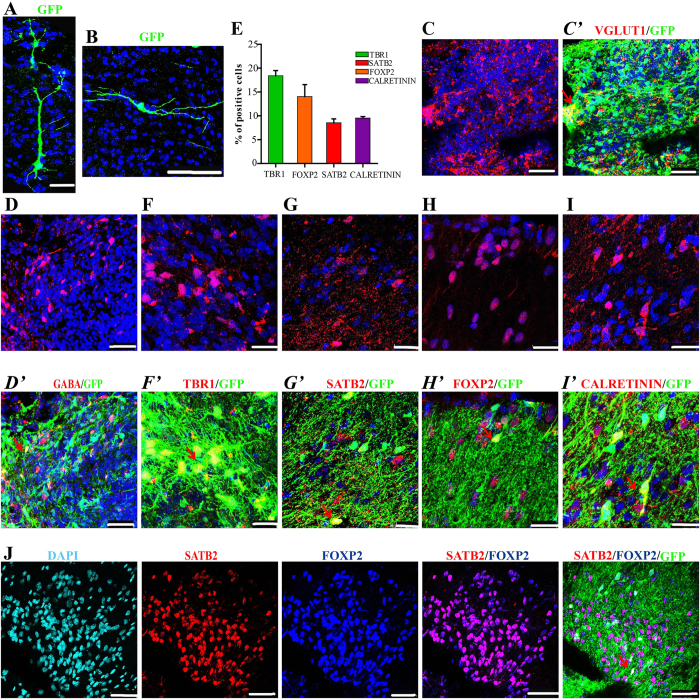
Figure 6. NESCs differentiated into CfuPNs and interneurons in the brains three months after grafted.
(A,B) GFP+ neurons migrated out of graft sites displayed a pyramidal (A) or bipolar (B) morphology. (C,D) Grafted cells differentiated into vGLUT1 positive neurons (C) and GABA positive neurons (D). The two representative images are from two different regions of an implant. (E) Quantification of TBR1+, SATB2+, FOXP2+ and CALRETININ+ interneurons in vivo at three months after transplantation. Data expressed as mean ± s.d (n = 3). (F–H) The representative images of TBR1 (F,F’), SATB2 (G,G’) and FOXP2 (H,H’) CfuPNs derived from grafted cells. These representative images are from three different regions of an implant. (I) NESCs give rise to CALRETININ interneurons in vivo. (J) Immunofluorescence showed all SATB2+ neurons were positive for FOXP2. Red arrows indicate double positive Fibers. Scale bars: (A,B,K), 100 μm; (C,D,J), 50 μm; F-I, 25 μm. Blue (except J): DAPI, nuclear staining.

