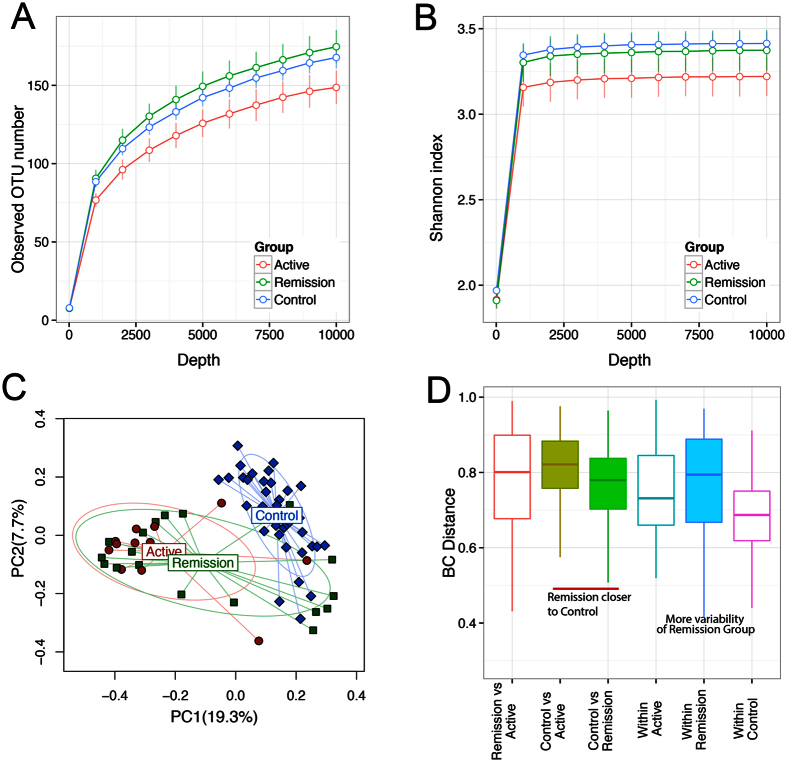
Figure 2. Gut microbiota of MS patients differs from healthy controls.
(A,B) Rarefaction curves comparing the species richness (observed OTU number) and overall diversity (Shannon index) between controls, remission RRMS and active RRMS. The microbiota of active disease has lower diversity. (C) Principal coordinate plot based on Bray-Curtis distance matrix. The first two coordinates are plotted with the percentage of variability explained indicated on the axis. Each point represents a sample with colors representing different states. The control samples are significantly different from MS samples. The remission phase samples show greater heterogeneity with subsets resembling control or active disease samples. The ellipses do not represent any statistical significance but rather serve a visual guide to group differences. (D) Boxplots comparing Bray-Curtis distances between various groups. The three horizontal lines of the box represent the first, second (median) and third quartiles respectively with the whisk extending to 1.5 inter-quartile range (IQR).

