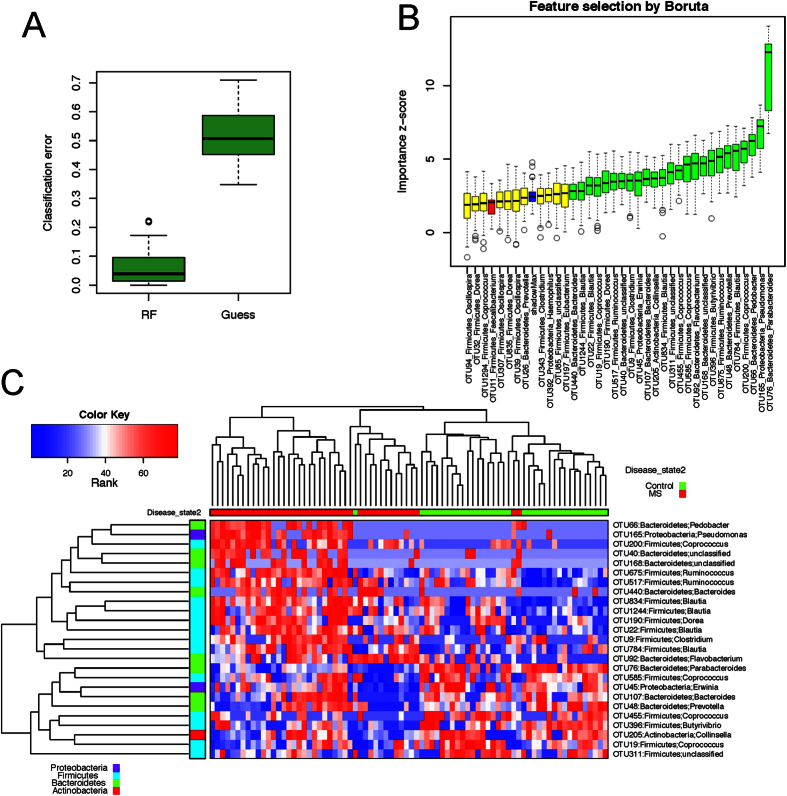
Figure 5. Predictive model based on the OTU level abundance profile using Random Forests (RF).
(A) Comparison of the classification error of the RF trained model to guess, which always predicts the class label based on the majority class in the training data set. The boxplots are based on the results from 500 bootstrap samples. The three horizontal lines of the box represent the first, second (median) and third quartile respectively with the whisk extending to 1.5 inter-quartile range (IQR). RF achieves significantly lower classification error. (B) Predictive power of individual genera assessed by Boruta feature selection algorithm. Blue boxplots correspond to minimal, average and maximum Z score of shadow genera, which are shuffled version of real genera introduced to RF classifier and act as benchmarks to detect truly predictive genera. Red, yellow and green colors represent rejected, suggestive and confirmed genera by Boruta Selection. (C) Heatmap based on the abundance Boruta selected genera. Hierarchical clustering (Euclidean distance, complete linkage) shows that MS samples tend to cluster together.

