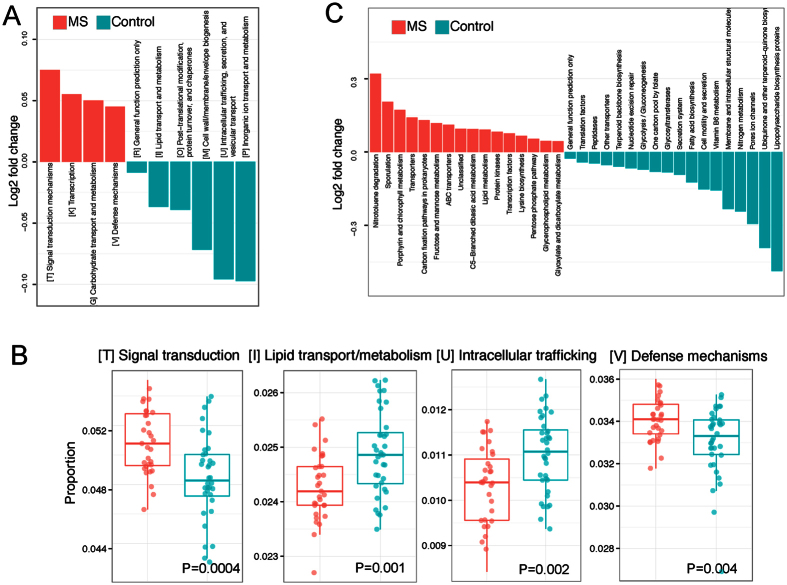
Figure 6. Functional analysis of the MS gut microbiota.
PICRUSt was used to infer the functional content of the gut microbiota based on the 16S data. (A) Log2 fold change of the abundances of COG categories showing significant difference between MS and control at a false discovery rate of 5%. Red and blue colors indicate increase and decrease in the MS samples. (B) Boxplots comparing the abundance distribution of the top 4 differential abundant COG categories. (C) Log2 fold change of the abundances of KEGG categories showing significant difference between MS and control at a false discovery rate of 5%.

