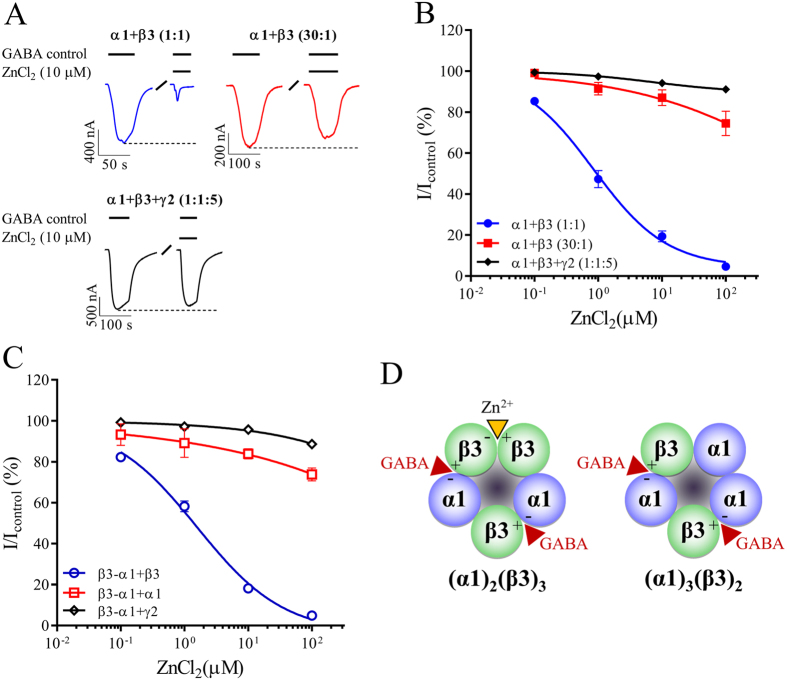
Figure 2. Zn2+ inhibition of GABA-evoked currents from α1β3 and α1β3γ2 GABAA receptors.
Xenopus laevis oocytes were injected with cRNA and subjected to two-electrode voltage clamp electrophysiology as described in the methods. Control currents (Icontrol) were evoked using a GABA concentration corresponding to ~EC50 and inhibition by Zn2+ was evaluated by co-applications with GABAcontrol. (A) Representative GABA-evoked current traces from oocytes injected with the denoted cRNA mixtures. Bars above each trace indicate GABA and Zn2+ application periods. Dotted lines indicate the peak current amplitude by GABAcontrol and “/” a wash period. (B,C) Concentration-response relationships of Zn2+ inhibition of GABAcontrol-evoked currents at α1β3 or α1β3γ2 receptors stemming from injecting the indicated cRNA mixtures using free subunits (B) or a concatenated β3-α1 construct (C). Averaged Zn2+ inhibition values were depicted as means ± S.E.M as a function of the Zn2+ concentration and fitted to the Hill equation by non-linear regression. Regression results for α1 + β3 (1:1) were IC50 = 0.84 (95% CI: 0.53–1.3), nH = −0.5 ± 0.32 and for β3-α1 + β3 (1:2) were IC50 = 1.6 (95% CI: 1.1–2.4), nH = −0.6 ± 0.06. For the remaining cRNA mixtures, Zn2+ inhibition at the maximal tested concentration was too low to allow for meaningful fitting. Each data point represent experiments from n = 5–8 oocytes of ≥2 batches. (D) The depiction of α1β3 GABAA receptor stoichiometries from Fig. 1D was modified to indicate Zn2+ binding in the β3(+)-β3(−) subunit interface (red/orange arrowhead).

