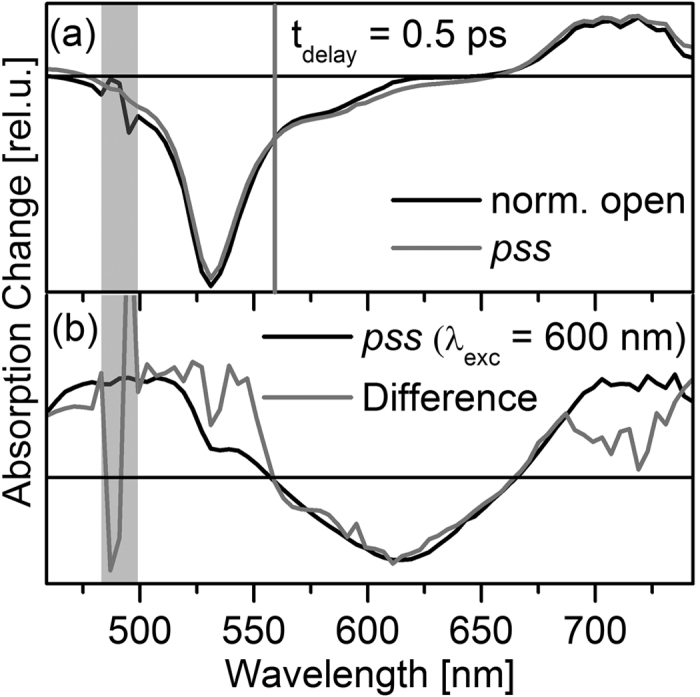
Figure 6.

(a) Spectra for BODIPY–DTE in the open state and the pss recorded at tdelay = 0.5 ps after photoexcitation at 500 nm. The spectra were normalized to the same signal amplitude at λpr = 560 nm (gray vertical line). (b) Comparison of the spectrum at tdelay = 0.5 ps after photoexcitation of the DTE residue (λpump = 600 nm) and the difference between the spectra depicted in (a); in the latter spectrum the region of strong noise due to pump light is indicated by a gray bar.
