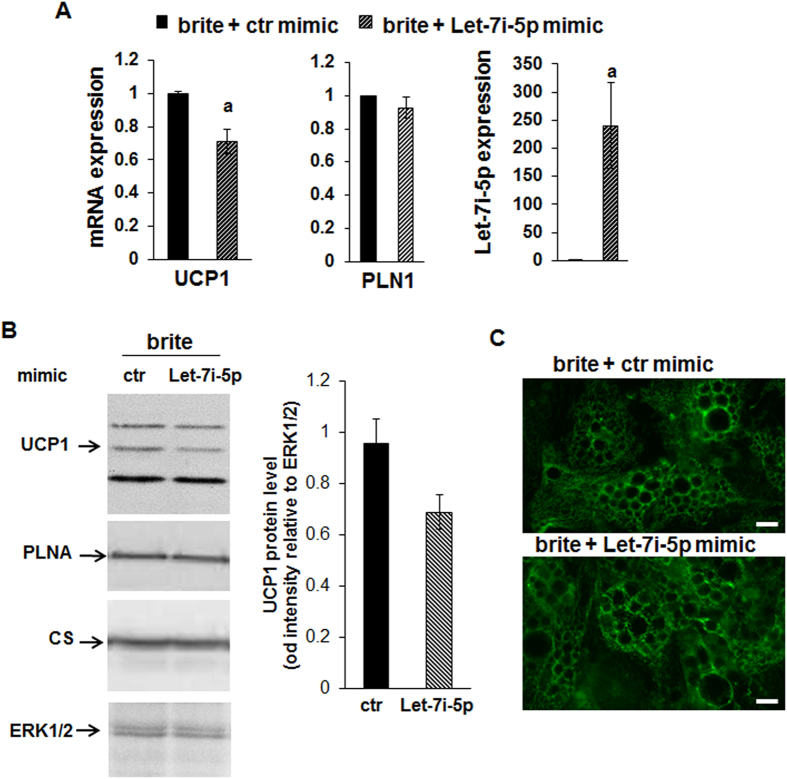
Figure 3. Effects of Let-7i-5p over-expression on hMADS brite adipocytes.
hMADS cells were transfected with a Let-7i-5p mimic or a control mimic at day 14 and then differentiated into brite adipocyte and analyzed at day 18. (A) mRNA and miRNA expression was evaluated by RT-qPCR. (B) UCP1 and PLNA protein levels were evaluated by immunoblotting. ERK1/2 was used as a loading control. Histograms show the quantification of the band intensities (n = 2). (C) Immunostaining for UCP1. Results are mean +/− SEM of 6 independent experiments performed on different series of cells. a: p < 0.05. Scale bar: 20 μm.

