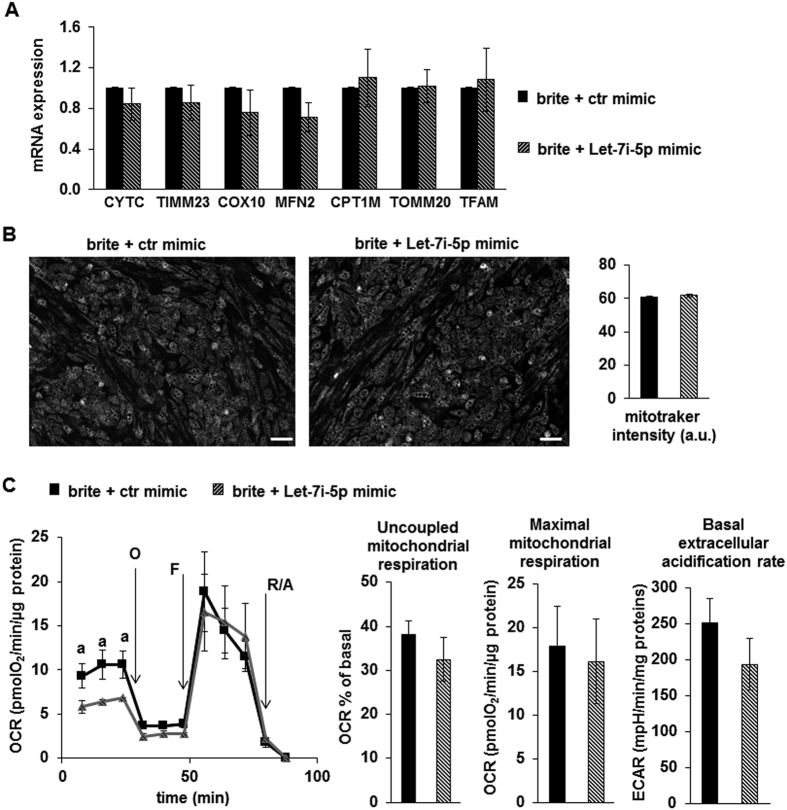
Figure 4. Effects of Let-7i-5p over-expression on the mitochondria function of hMADS brite adipocytes.
hMADS white adipocytes were transfected with the Let-7i-5p mimic or control mimic at day 14 and then induced into brite adipocytes and analyzed at day 18. (A) mRNA expression of various key mitochondrial markers evaluated by RT-qPCR. (B) Alive adipocytes were incubated with MitoTraker Green as a probe for mitochondria independently of their activities and the signal was quantified and is presented as histograms. (C) Oxygen consumption measurements were performed at day 18. Plots show cellular OCR (O: oligomycin; F: FCCP; R/A: rotenone/antimycin A), and histograms show mitochondrial respiration values as well as the ECAR assessed under basal condition. Plots and histograms show the mean ± SEM, n = 6 (A & B) or 8 (C). a: p < 0.05. Scale bar: 150 μm.

