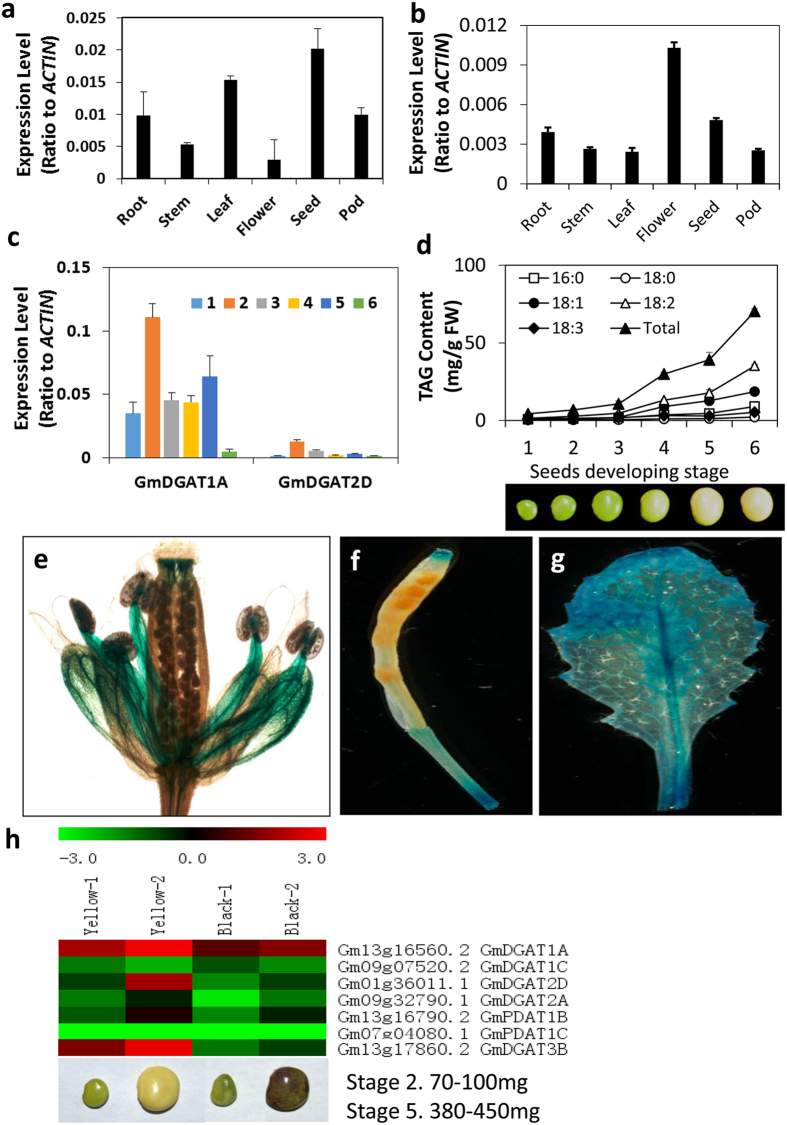
Figure 1. GmDGAT1A and GmDGAT2D expression pattern.
The tissue expression patterns of GmDGAT1A and GmDGAT2D in nodule, root, stem, leaf, flower, pod, seed was tested by qRT-PCR with actin as internal standard. Seeds at different development stages were harvested. Six developmental stages are: stage 1. 40–70 mg; stage 2. 80–100 mg; stage 3.150–200 mg; stage 4. 250–300 mg; stage 5. 350–430 mg; stage 6. 320–350 mg. (a) Tissue specific expression of GmDGAT2D. (b) Tissue specific expression of GmDGAT1A. (c) GmDGAT1A and GmDGAT2D expression at various seed developmental stages. (d) TAG accumulation and fatty acid composition changes in various seed developmental stages (e–g) GmDGAT2D promoter-driven GUS expression in Arabidopsis flower (e), GmDGAT2D promoter-driven GUS expression in Arabidopsis silique (f) and leaf (g). (h) GmDGAT2D and GmDGAT1A expression patterns in comparison of other DAGT genes. Soybean Illumina expression data obtained from developing seeds of two varieties with PI 84970 (Hokkaido, seed with a black seed coat) and PI 518671 (Williams 82, seed with yellow seed coat) at the developmental stages of 2 and 5. Data are presented as averages of three biological replicates ± SD.

