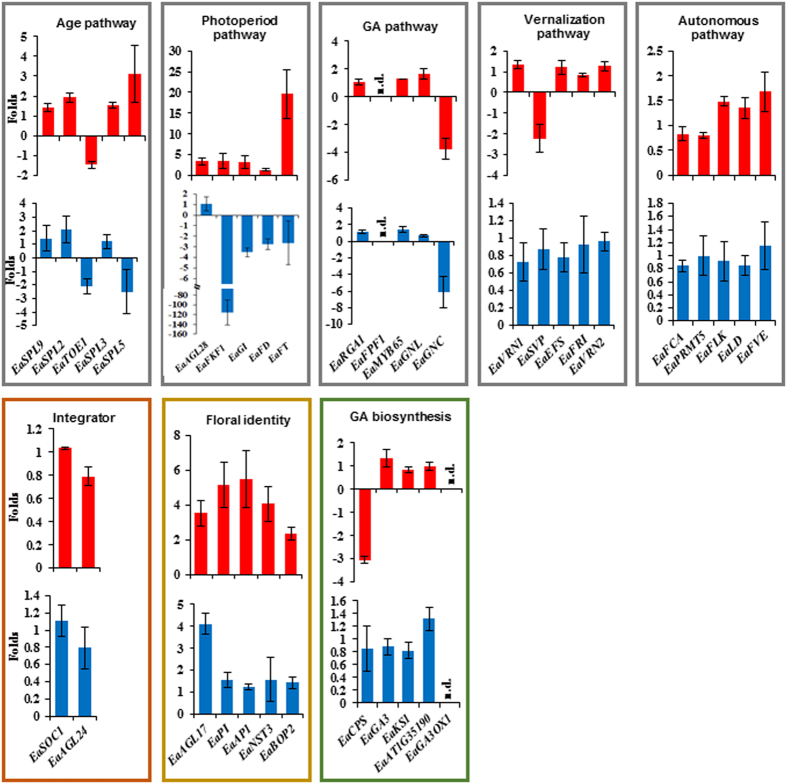
Figure 5. Results of qRT-PCR on selected genes from each pathway or group after treating with GA3 in VG (red) and HG (blue) plants.
Data plotted are the fold changes representing the relative difference in expression between GA3 treated and untreated (as 1) samples. A positive value indicates induction while a negative value indicates reduction after GA3 treatment. Data shown are the average (n = 3 pairs of VG and HG plants) ±s.d. n.d.: not detected.

