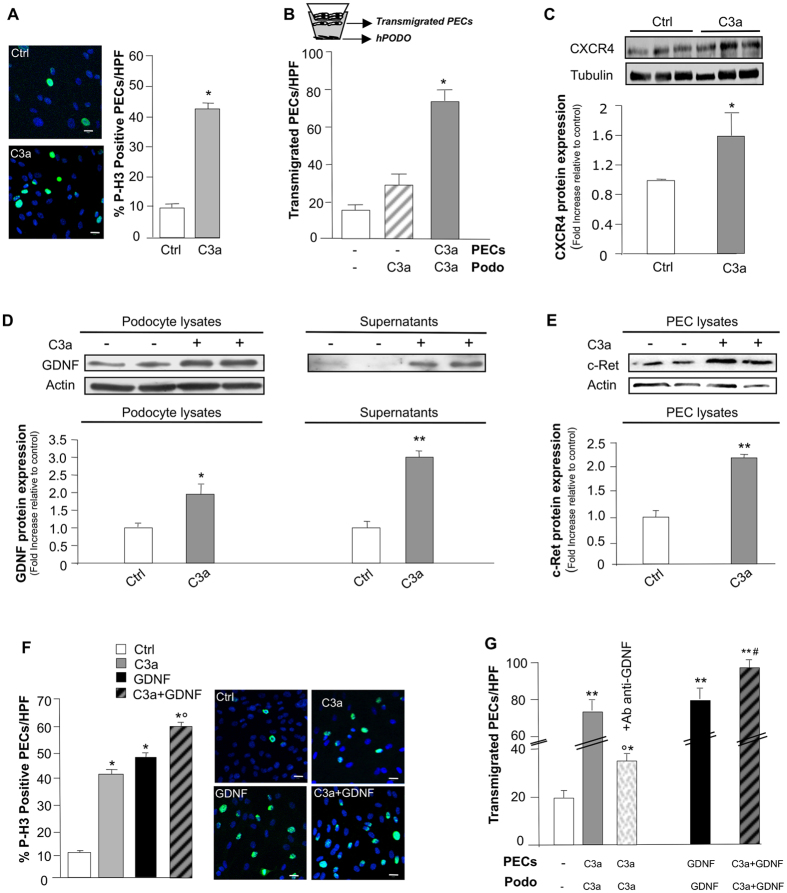
Figure 5. C3a-dependent PEC activation is enhanced by podocyte-derived GDNF in vitro.
(A) Representative images of P-H3 (green) and DAPI (blue) in untreated (Ctrl) or C3a-treated PECs (24 hours). Quantification of proliferating PECs (P-H3+) exposed to medium or C3a (1 μM). Data expressed as percentage of P-H3+PECs per total DAPI-positive cells/HPF (5–8 random fields, n = 5 experiments). *P < 0.001 versus Ctrl. (B) Quantification of cell migration in co-culture transwell system of podocytes and PECs (see scheme) exposed to medium or C3a. Data expressed as number of PECs migrated from the upper chamber across the filter towards podocytes/HPF (5–8 random fields, n = 4 experiments). *P < 0.001 versus Ctrl and C3a-Podo. (C) Representative Western blotting and densitometric analysis of CXCR4 protein in untreated or C3a-stimulated PECs (15 hours). Tubulin used as sample loading control (n = 3 experiments). *P < 0.05 versus Ctrl. (D) Western blotting and densitometric analysis of GDNF in untreated or C3a-activated podocyte lysates (left panel) and supernatants (right panel) 15 hours. Actin used as sample loading control (n = 4 experiments). *P < 0.05, **P < 0.01 versus Ctrl. (E) Western blotting and densitometric analysis of c-Ret in untreated or C3a-stimulated PEC lysates (15 hours). (n = 3 experiments). **P < 0.01 versus Ctrl. (F) Representative images of P-H3 (green) and DAPI (blue) in untreated, C3a-, GDNF- or C3a + GDNF-treated PECs (24 hours). Scale bar: 20 μm. Quantification of proliferating P-H3+PECs exposed to medium, C3a, GDNF (100 ng/ml) and C3a + GDNF. Data expressed as percentage of P-H3+PECs per total DAPI-positive cells/HPF (5–8 random fields, n = 5 experiments). *P < 0.001 versus Ctrl; °P < 0.01 versus C3a- and GDNF-treated PECs. (G) Quantification of PEC migration in co-culture transwells from the upper chamber towards unstimulated or C3a-activated podocytes (24 hours) in the presence or absence of the anti-GDNF antibody. In additional samples, PECs and podocytes were exposed to GDNF or C3a + GDNF (24 hours). Data expressed as transmigrated PECs/HPF (5–8 random fields, n = 4 experiments). *P < 0.05, **P < 0.001 versus unstimulated cells; °P < 0.001 versus C3a, GDNF and C3a + GDNF-treated PECs; #P < 0.01 versus C3a- and GDNF-treated PECs. Data information: Values are presented as mean ± SEM. Scale bars: 20 μm. (A,B,F,G) ANOVA corrected with Bonferroni coefficient or (C,D,E) unpaired Student’s t-test.

