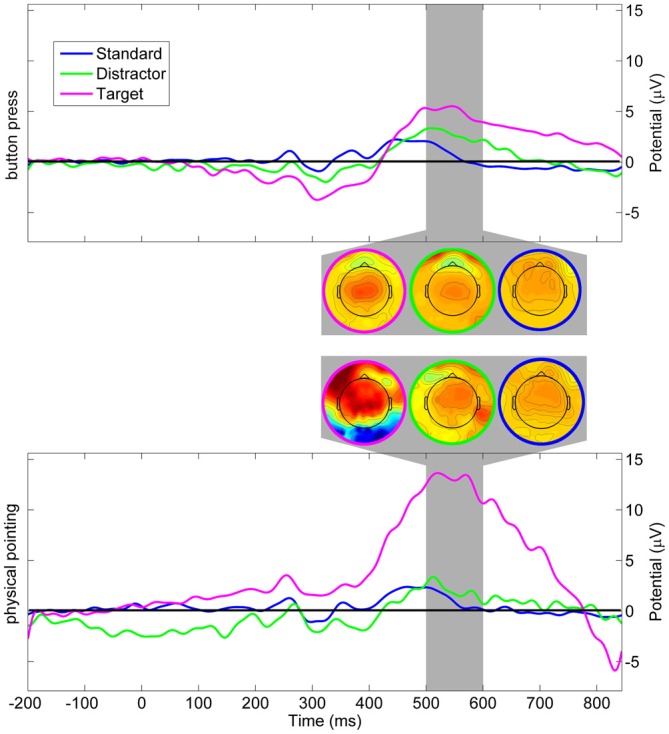
Figure 6.

Grand average event-related potential (ERP) at Pz’. Upper panel displays scalp potentials in the button press condition, lower panel displays scalp potentials in the physical pointing condition. Blue: standard stimuli, green: distractor stimuli, magenta: target stimuli. The dark gray area displays the latency range of the mean topographic EEG maps for the different stimuli and response conditions.
