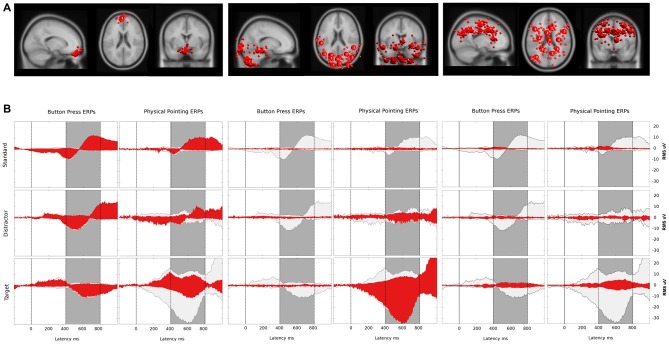
Figure 8.
(A) Bigger spheres represent cluster centroids and smaller spheres display individual ICs representing horizontal and vertical eye movement activity (left), neck muscle activity (middle) and brain activity (right). The two clusters representing eye activity in the left column consisted of 12 ICs and 11 ICs, respectively. Neck muscle activity in the middle column is represented by 12 clusters comprising an average of 7.8 ICs (range: 4–10, σ = 1.5). Brain activity is represented in the right column by 12 clusters comprising on average 8.8 ICs (range: 6–11, σ = 1.5) from 12 participants. Cluster locations are projected onto the standard MNI brain volume and displayed in sagittal, horizontal, and coronal views. (B) Red: ERP contributions of clusters representing eye movement (left), neck muscle (middle), and brain (right) activity. Light gray: ERP envelopes of all 36 back-projected clusters. The dark gray area displays the latency range of the P3 component from 400–800 ms after a color change. The left and right columns display envelopes for the button press and the physical pointing condition, respectively, with rows displaying from top to bottom the different stimuli (standard, distractor and target).

