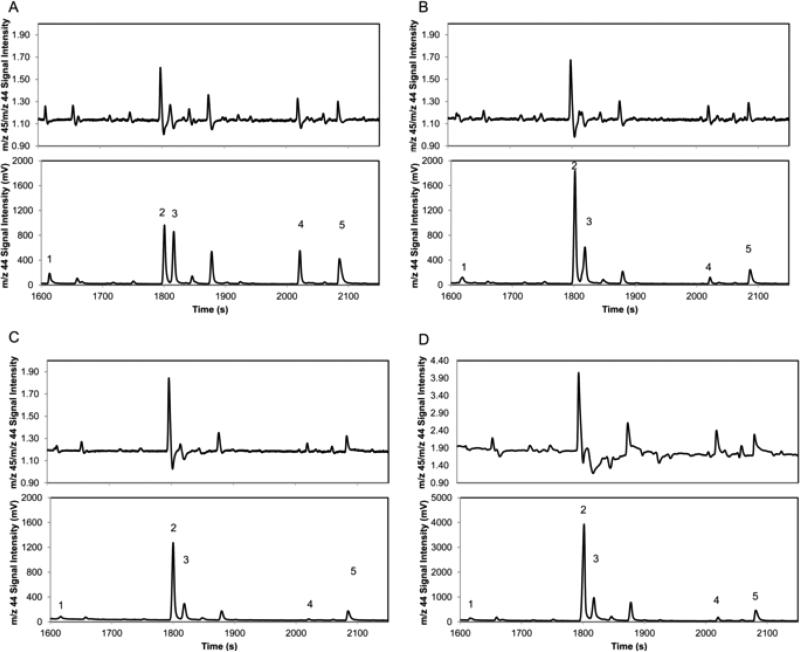
Figure 1.
IRMS chromatograms of wine extract at different levels of 13C enrichment: (A) control; (B) 0.01% [U-13C]-glucose; (C) 0.1% [U-13C]-glucose; (D) 1.0% [U-13C]-glucose. The m/z 44 and 45 signals represent CO2 ions containing 12C and 13C, respectively, from aroma compounds after separation and combustion. The top trace of each chromatogram depicts the 45/44 ratio. Peak identification: 1, hexyl acetate; 2, ethyl lactate; 3, hexanol; 4, ethyl octanoate; 5, acetic acid.

